As of today, the joint U.S.–Israel strikes on Iran have entered their third day. International futures markets, as expectations about the direction of the war have shifted, have gone through a clear sequence: sharp volatility, then a period of tight balance with slowing swings, and now a renewed pickup in volatility. A war-driven pullback in global risk appetite, together with a surge in safe-haven demand, is gradually turning into a broader wave of portfolio rebalancing.
This round of fighting—where major world powers and a major Middle Eastern state are directly entering the battlefield—seems to have convinced many global analysts that the conflict may be moving beyond a localized event and toward a wider confrontation. Meanwhile, the U.S.–Israel side’s unsparing “decapitation” actions against Iran have also made people question whether the war can realistically be calmed down in a short time. That is why, even though the U.S. equity VIX index is still sitting at relatively low levels, as more evenly matched clashes arrive one after another, the VIX is now breaking out of its previous range and starting to attempt an upward rebound.
But it’s also clear that panic hasn’t spiraled out of control. Capital is cautious, yet positioning remains very conservative when it comes to putting on large bearish bets against equities. It feels like most people are still waiting and watching, and they generally believe we are not at the point of an emotional breakdown.
At the same time, the way the futures market is “connecting the dots” on volatility is gradually shifting. The dominant driver is moving away from the old chain of “growth and interest rates” and toward a new one: “geopolitical risk and tail risks such as energy and broader supply-chain disruptions.” Therefore, until the war ends, our analysis of equity index futures, commodities, precious metals, and FX futures should all start from one core entry point: how war-driven changes in expectations are evolving, and what that implies for the outlook of global futures markets.
So let’s do this. We’ll walk through the key futures-market opportunities worth watching now that the latest three-way conflict among the U.S., Israel, and Iran has reignited volatility in global futures.
First, let’s map out the timeline of events in this round of war. Then we’ll look at how futures markets tended to move in similar historical episodes—and what changes are most worth paying attention to this time.
According to real-time reporting from major international media, the escalation in military violence in the Middle East has entered its third day. Strikes by the U.S. and Israel on Iran are still ongoing, and have triggered Iranian counterattacks using missiles and drones. Multiple countries across the region have seen disruptions such as explosions, airspace closures, and heightened military alerts. In financial markets, the “first-principles variables” for this kind of conflict are usually: a sudden jump in risk premia and volatility; shifting expectations around shipping and sanctions (especially the probability of supply disruptions linked to the Strait of Hormuz); and renewed inflation pressure driven by higher oil prices.
First focus: Equity index futures
The first reaction on the equity side is typically a drop in risk appetite and a rise in volatility. We can already see that stock indices in major economies that had performed well—such as the U.S., China, Japan, and South Korea—have shown signs of topping out and pulling back. Whether these drawdowns turn into a sustained bearish trend will depend to a large extent on whether higher oil prices push U.S. inflation expectations back up and alter the Federal Reserve’s expected rate path.
A well-known IMF empirical study offers a practical rule of thumb: a 10% rise in global oil inflation tends, on average, to lift U.S. domestic inflation by about 0.4 percentage points on impact (with the effect fading over time).
For U.S. equity index futures—such as S&P 500 $S&P 500(.SPX)$ Nasdaq 100 $E-mini Nasdaq 100 - main 2603(NQmain)$ and Russell 2000 $iShares Russell 2000 ETF(IWM)$ —this chain matters the most. If oil prices rise → inflation expectations rise → real rates or the term premium rebound, valuation pressure in index futures is likely to show up before any hit to earnings does. The Russell 2000 is often more sensitive: once the S&P comes under pressure and breaks down in the short term, small caps can fall faster and further.
$S&P 500(.SPX)$ $Tradr 2X Long Innovation 100 Monthly ETF(MQQQ)$ $Invesco QQQ(QQQ)$ $Dow Jones(.DJI)$ $DIALIGHT PLC(DIA.UK)$ $E-mini Dow Jones - main 2603(YMmain)$ $iShares Russell 2000 ETF(IWM)$ $Direxion Daily Small Cap Bull 3x Shares(TNA)$ $iShares Russell 1000 ETF(IWB)$
In addition, Asia-Pacific indices that had rallied strongly—A50, $MSCI China A50 Index - main 2603(MCAmain)$ $FTSE China A50 Index - Feb 2026(CN2602)$ Hang Seng, $HSI(HSI)$ $HSTECH(HSTECH)$ Hang Seng Tech, Nikkei futures $Nikkei 225 Index(N225.JP)$ , and South Korea’s equity market—are also showing signs of topping and turning down, with Nikkei futures showing a more serious technical breakdown.
When risk appetite fades, short opportunities in the index futures that break down first can be attractive. But you should also be mindful that any sudden easing in war expectations can whip markets around, so shallow stop-losses are a must.
Let’s look at which equity index futures are most worth watching right now.
@owen 美股头部结构仍未被打破叠加美伊冲突风险,逢低看涨黄金和VIX依然要考虑_老虎社区_美港股上老虎 - 老虎社区
Key strategy
My current strategy remains unchanged: I am still taking a small-size bearish options position on SPY and holding a long position in VIX, waiting for the current stalemate to break. Before the holiday, I discussed in detail why I’ve remained bearish on U.S. equities—this is not simply because the charts are showing a clear topping structure.
It’s also because, if you look at the overall volatility logic of U.S. Treasury yields, whether yields move up or move down—and whether the U.S. dollar index rises or falls—either direction can still add downside selling pressure to U.S. equities that are already at elevated levels. The key technical levels are here:
The S&P 500 is still oscillating inside a high-level trading range, and the 50-day moving average is about to cross below the 100-day moving average (a potential “death cross”). The price action looks relatively weak. If the index breaks below the lower boundary of this range, a much larger drawdown could follow, so we have to stay on guard. Looking at the current S&P 500 index futures setup, the 20-day moving average has become a clear near-term cap, and multiple attempts to push higher and break above it have all failed.
So for now, we just need to keep a close eye on the yellow support line on my S&P futures chart—this also lines up with the support zone around the 20-week moving average.
Second focus: Precious metals and base metals futures
Next, let’s look at the logic for precious metals. The framework here is fairly straightforward: when geopolitical risk rises, risk assets tend to come under pressure, while gold often shows its hedging and diversification role. World Gold Council analysis has clearly noted that sudden spikes in geopolitical risk are often accompanied by equity sell-offs, while gold tends to hold up well in such episodes and can serve as a hedge against geopolitical shocks.
Key precious-metals-related futures contracts and factors to watch right now:
But one thing everyone needs to watch is this: as safe-haven demand has surged, the U.S. Dollar Index has also rebounded slightly. If this move continues, a stronger Dollar Index could keep putting downward pressure on gold and silver, as well as on Hong Kong and China (A-share) markets.
Not only will gold and silver—and the Hong Kong/China (A-share) markets—face pressure, but broad commodities such as base metals and agricultural products may also be capped and stuck in a high-level range: they can’t break down, but they also struggle to break higher.
On one hand, the geopolitical conflict is intense, and there is a real risk of supply chains being disrupted. With crude oil leading the way, the next wave of commodity-driven inflation could even accelerate. That would normally support further price gains in base metals such as copper and aluminum, and in other metals like zinc and various “minor/rare” metals.
On the other hand, the surge in risk-off sentiment has pushed the U.S. Dollar Index higher, which tends to suppress the upside in dollar-priced commodities and many commodity futures. That is why, even though the fighting has already lasted three days, we still haven’t seen these products really lift off under the war headlines to the extent many would expect:
Copper $Global X Copper Miners ETF(COPX)$
Aluminum $NANSHAN AL INTL(02610)$
Iron ore $TSI Iron Ore - main 2604(FEFmain)$
A big reason may simply be the stronger dollar.
So what about gold and silver—what kind of futures strategy can we consider here? At this point, futures traders may want to think about a “long gold/silver ratio” strategy (i.e., positioning for gold to outperform silver).
You can see that as gold pushed higher, the gold–silver ratio also dropped sharply. Since silver had previously outperformed gold by too much, we can now consider going long the gold–silver ratio. When a stronger U.S. dollar caps the upside in both metals, silver is more likely to pull back more than gold. In that case, a hedged structure like “two Micro Gold against one Micro Silver” may be worth considering. And as the chart above shows, the gold–silver ratio is also flashing a short-term technical sign of a double-bottom rebound.
At the same time, we should be aware that this market is heavily event-driven right now, which means silver’s swings can be large. So any silver short leg should use a tight stop-loss, to avoid being whipsawed by sudden squeezes during the pullback. A practical reference, as some experienced traders in the community have discussed before, is to use silver’s 10-day moving average as a stop-loss guide.
Now let’s look at gold specifically—how experienced community traders are thinking about strategy there.
Key strategy recap:
Our expectation is that the Iran situation will not expand further into other regions, and it is even less likely to trigger the so-called “third season.” The higher-probability path is that, after a few rounds of symbolic retaliation by Iran, Trump will loudly declare that the objectives have been achieved and bring it to an end. Both sides would then get the “face” and the outcome they want.
Based on that scenario, the assets that benefited early this week may start to give back part of their gains once the initial “good-news premium” fades. But that does not mean direct beneficiaries like crude oil and gold must reverse and fall; more likely, they enter a new trading range and trade with volatility.
One more reminder: after the previous sharp sell-off and correction, both gold and silver are in a short-to-medium-term consolidation phase, which tends to suit “sell high, buy low” range trading. Historically, after gold makes new highs, it often needs about a quarter to digest and consolidate, so this adjustment may last until around the end of Q2. Over the long run, gold still has a chance to make new highs, but it likely needs to hold above 6,000 to confirm the bull trend; silver may have already topped out around the 120 area. And based on gold’s historical correction path, an adjustment lasting only one month doesn’t really fit—so unless we get an unexpected black swan or a larger-scale conflict, making new highs again in the near term will likely be difficult.
For gold, consider range trading in April–May within the 4,423–5,626 zone: sell near the top and buy near the bottom, with priority on buying dips. A key resistance level is 5,380, where you can look for a short setup. On the downside, the 4,830, 4,745, and 4,600 levels are support areas where you can consider opening or adding to positions.
直播文字回顾:美以伊三方冲突一触即发,原油黄金的关键位置解析_老虎社区_美港股上老虎 - 老虎社区
Key Focus: Crude Oil Trading Insights:
Crude oil (WTI/Brent) is the pricing center of this round of conflict, because the Strait of Hormuz is a critical bottleneck for global energy transport. The EIA reports that in 2024, oil flows through the strait averaged about 20 million barrels per day—roughly 20% of global petroleum liquids consumption—and that flows in 2024 and in Q1 2025 accounted for more than one-quarter of total global seaborne oil trade. The EIA also stresses that if this chokepoint is disrupted, alternative routes are limited; even a brief interruption can delay supply, raise shipping costs, and push global energy prices higher.
A list of oil and natural-gas futures contracts worth watching right now:
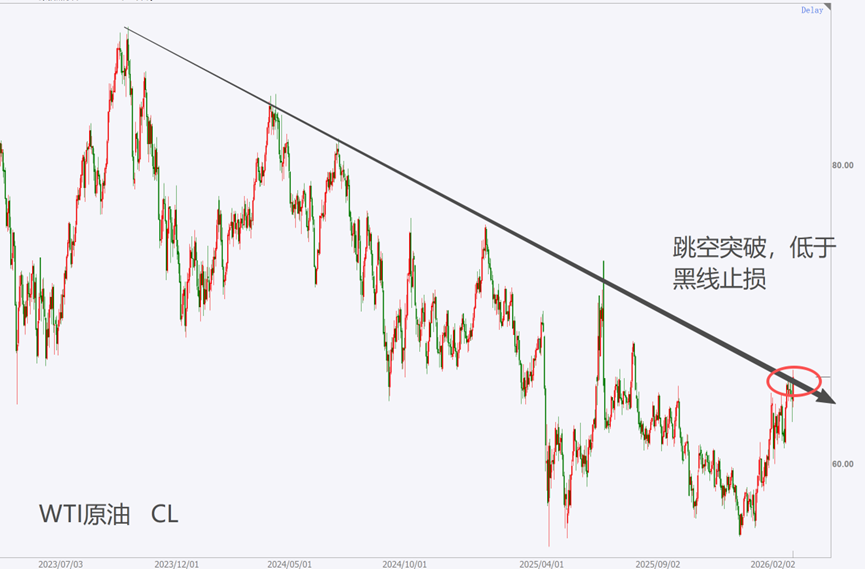
This means the “upside tail” for oil prices is driven more by probabilities—whether shipping gets disrupted and whether the conflict escalates—rather than by near-term inventory data itself. When the war broke out, WTI opened with a sharp gap higher on day one and briefly pushed above the 74 level. After that, crude moved into a mild consolidation range. Now, with the risk of escalation rising again, WTI has started to grind higher once more. So for oil, what are the key points futures traders need to pay attention to?为什么特朗普这次不再TACO,美以对伊发动战争想得到什么?(原油行情要大爆发?)_老虎社区_美港股上老虎 - 老虎社区
Key strategy recap:
If we focus on market opportunities, I think crude oil and gold are almost certain to get a short-term boost and spike higher. Silver is a different story: it has already run up too much, volatility is high, and overhead resistance at the previous highs is heavy—so I wouldn’t recommend placing an oversized bet there. In crude oil, one thing to note is that each rebound from a low tends to produce roughly a 3.3 “points” upswing to the upside:
Right now, WTI crude is holding around 67, so in the very short term there’s a high probability it pushes above 74, and even toward 80—beyond that, it becomes a heavier resistance zone.
Before the broader supply–demand structure improves, it’s hard for oil to deliver a large weekly uptrend, and short-term trading can be tricky. It’s very possible that when oil futures reopen on Sunday night, price gaps up straight above 74 and then runs hard. But once there are signs of de-escalation, crude can drop sharply as well. So if you’re trading this move short-term, stay glued to headline risk, use trailing take-profit, keep stop-losses tight, or consider using long options to express a view on a sharp upside move.
Alternatively, you can consider buying the near-dated WTI futures (CL2604) and hedging by shorting the deferred WTI contract (CL2607), using a three-month calendar bull spread. This type of spread trade is commonly used when an event triggers a sudden oil spike.伊朗封锁海峡将引发全球通胀席卷而至?原油长期看破百不是难事_老虎社区_美港股上老虎 - 老虎社区
Key strategy recap:
Based on current headlines, Iran has effectively blocked the Strait of Hormuz. So on Monday’s open, we should watch how big the gap-up is. If the open is below 70, it may still be worth going long—because when the U.S. and Israel attacked Iran’s nuclear facilities last year, the oil high was around $73, and a real disruption at the strait should, in theory, price above that prior peak. If crude gaps well above 70, it may be better to first see whether the market partially fills the gap, and then consider entering if it dips back below 70.
I’ve also been emphasizing that oil can have a “double-from-the-lows” type of opportunity. The headlines are now cooperating; the key is how long the situation lasts. Over the next 2–3 months, it wouldn’t be hard to see a peak above $100, but the path will be extremely volatile. You can reference the oil price swings during the Iran–Iraq war period from July to October 1990 (oil roughly doubled within three months, and then gave back the entire move).
$United States Oil Fund LP(USO)$ $United States Brent Oil Fund LP(BNO)$ $LS 2X LONG WTI OIL ETP(2OIE.UK)$
Final focus: FX futures
In FX futures, the most important thing right now is understanding the impact of “the high-beta currencies to the ultimate safe haven: the U.S. dollar.”
The dollar’s safe-haven role is a basic starting point for FX analysis. In a financial stability special topic, the ECB notes that in recent decades, U.S. Treasuries and the U.S. dollar have typically been regarded as safe havens during risk-off episodes, supported by factors such as deep and liquid U.S. markets and the dollar’s reserve-currency role. The Minneapolis Fed’s discussion of “global flight to safety” also emphasizes that such safe-haven shocks tend to coincide with a stronger dollar, wider borrowing spreads, and tighter global financial conditions.
A stronger dollar usually implies weaker non-dollar currencies. And when the dollar turns firm, the euro—its largest counterpart—often becomes a prime target for traders looking to short. If we look at the euro’s current setup, we can also see clear bearish signals:
So if the rebound in the U.S. Dollar Index can extend, the downside move on the euro may be easier to trade—worth keeping on your watchlist.
Also, several other FX futures contracts could pull back if the dollar continues to strengthen on risk-off flows. If you know the FX market well, you can track them closely:
$British Pound - main 2603(GBPmain)$ $Australian Dollar - main 2603(AUDmain)$ $Australian Dollar - Mar 2026(AUD2603)$ $Japanese Yen - main 2603(JPYmain)$ $Canadian Dollar - main 2603(CADmain)$ $SEK/CNY(SEKCNY.FOREX)$
Alright, that wraps up this futures-market scan. If you have your own views on the opportunities created by the U.S.–Iran war in today’s futures markets, feel free to drop a comment below. We’ll award 20–25 Tiger Coins to the most insightful comments.
Comments