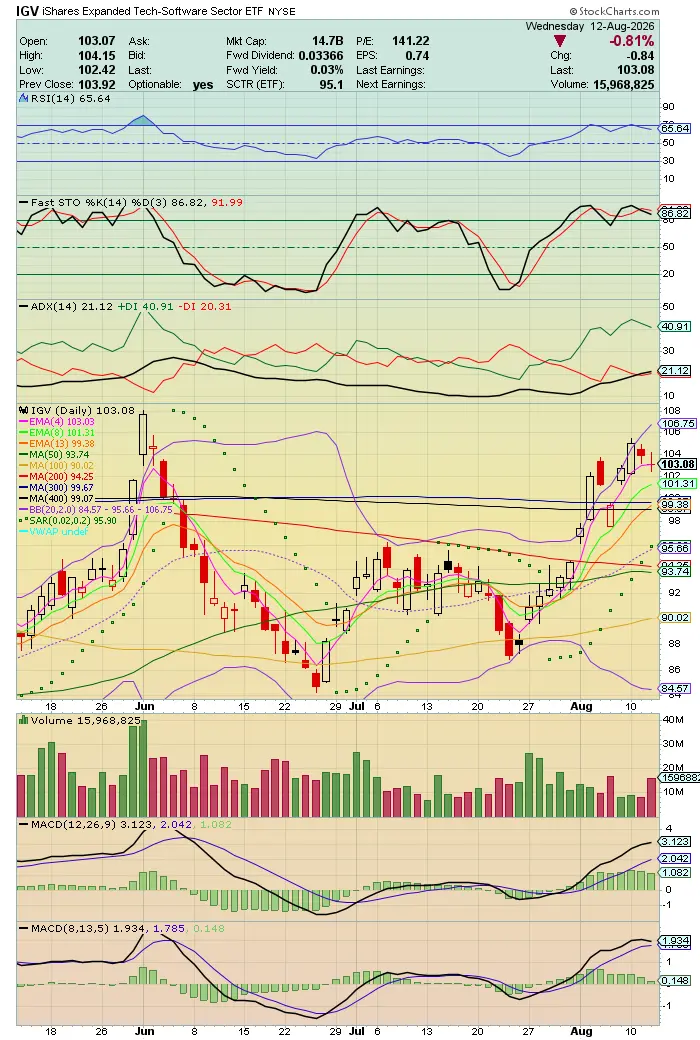
$iShares Expanded Tech-Software Sector ETF(IGV)$ Daily chart shows a W double bottom, with the jar filled at 108. A doji candle formed after a small dip near the EMA 4 support at 103.03. The close was just above EMA 4, and as long as that holds, the bulls stay in control. The doji points to indecision, and this zone will probably get resolved soon. If EMA 4 fails to hold, the 300 and 400 SMAs, lined up with ENA 13, could get tested. That support confluence would likely attract buyers. Bulls are watching for two things: a new high and a close above the closing price from the 10th.
Disclaimer: Investing carries risk. This is not financial advice. The above content should not be regarded as an offer, recommendation, or solicitation on acquiring or disposing of any financial products, any associated discussions, comments, or posts by author or other users should not be considered as such either. It is solely for general information purpose only, which does not consider your own investment objectives, financial situations or needs. TTM assumes no responsibility or warranty for the accuracy and completeness of the information, investors should do their own research and may seek professional advice before investing.
Comments