


The market is closed today, so I’m doing some consolidation. Additionally, I’ll closely track the opening positions for $KWEB$ and $FXI$ this week for data accumulation—stay tuned.
Currently, there’s a question: after Friday’s big rally, many people are wavering. So, will Chinese stocks pull back again?
Let’s take $KraneShares CSI China Internet ETF(KWEB)$ as an example. The signals for a pullback are relatively strong, as three types of major trades in end-of-trend strategies have appeared:
Buying puts: This happened last week, and I’ve summarized it.
Rolling near-term positions: Last Friday, there was an unusual large trade—rolling from the $KWEB 20250321 38.0 CALL$ to the $KWEB 20250221 39.0 CALL$ , shortening the expiration date from March 21 to February 28.
Buying near-expiration calls: Also last Friday, there was a roll of 13,000 contracts of $KWEB 20250221 34.0 CALL$ to 20,000 contracts of $KWEB 20250221 36.0 CALL$ .

However, the issue is that these strategies are left-side trades preparing for an imminent right-side move, meaning they can’t precisely predict when the pullback will occur.
To understand Friday’s closing situation, we still need to look at open interest (OI).
Although the latest data hasn’t been updated yet, we can roughly estimate it based on historical patterns and update the analysis on Tuesday with new data.
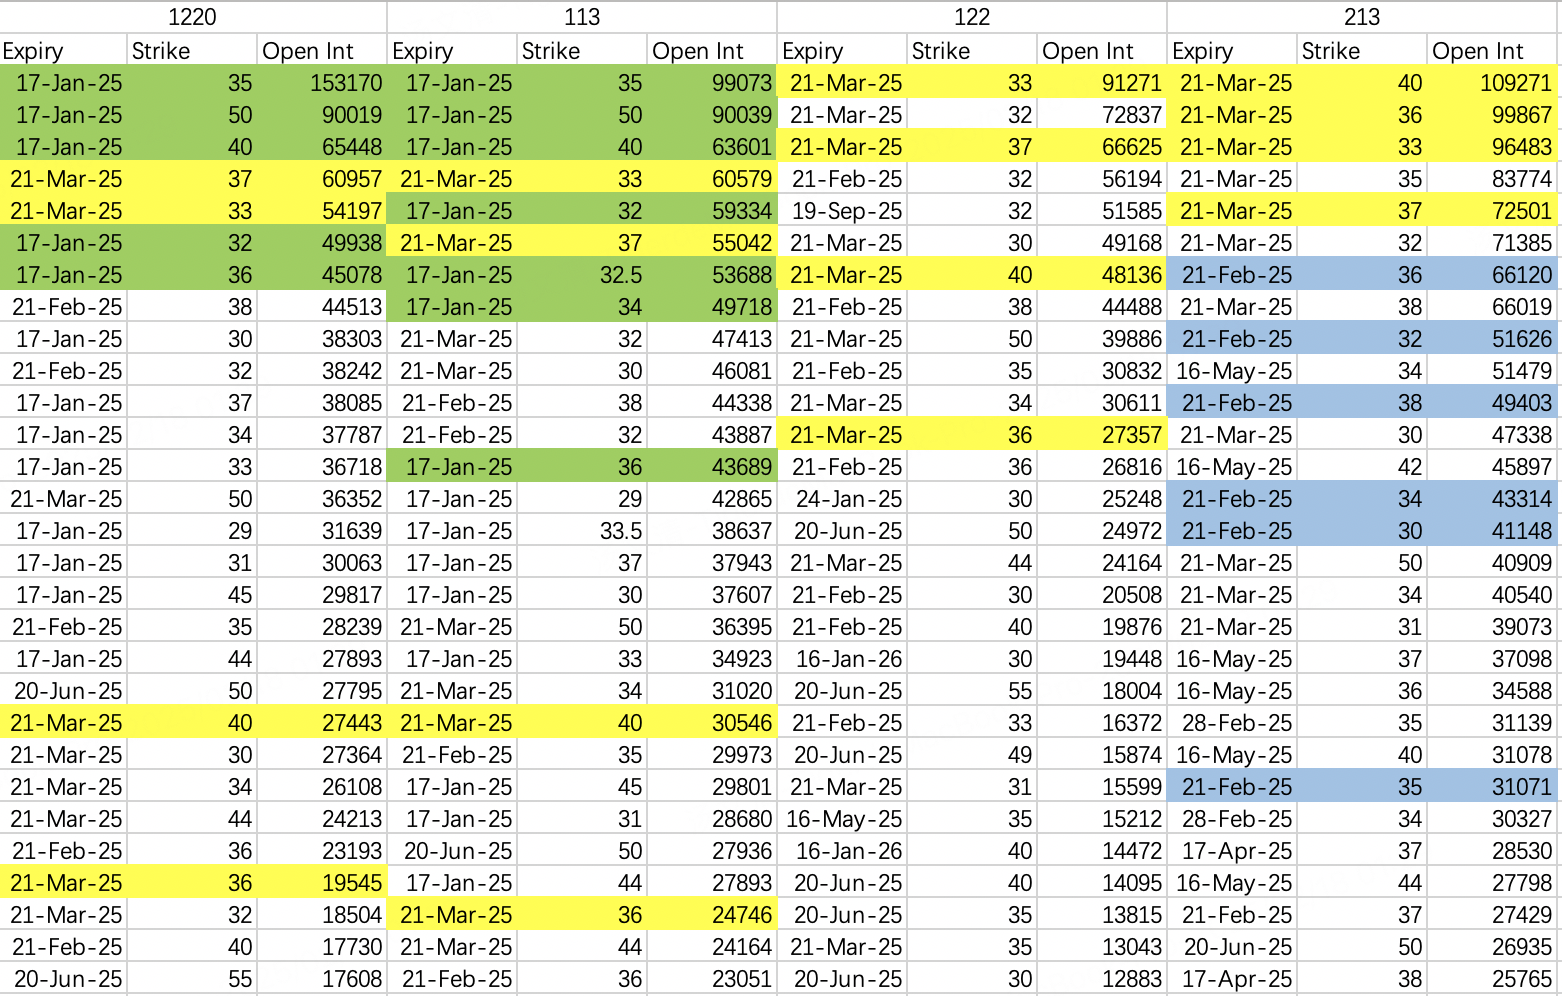
Below is a chart of $KWEB$ call option OI data, with four sets of dates: December 20, January 13, January 22, and February 13.
Green data represents January monthly options.
Yellow data represents March monthly options.
Blue data represents February monthly options, which expire this week.
From the chart, we can observe the following:
Most head OI options will lose value, and this process won’t resolve in the current week but will be completed in advance. For example, the green data lost value back in December.
The current head OI for $KWEB$ call options is in the March yellow data.
The February OI data has been reduced, but the remaining OI has grown, although it is still lower than the March data. Changes in the blue data during Tuesday’s session will need to be observed.
The head OI strike price layer is typically at-the-money or near-the-money but will shift to out-of-the-money by the expiration date.
I call the fourth point the “Head Must Bury Rule.” Currently, the March head is at 40, but the stock price hasn’t reached 40 during this rally. Therefore, 40 is most likely the true top.
For the blue data, the 36 strike is very easy to crush. This week, a rally followed by a pullback would suffice.
This forms my rough view of $KWEB$’s trend for this week. Tomorrow, we can update the data and reassess.
Additionally, I’ve also listed $NVIDIA(NVDA)$ data. It seems likely that the 140 strike call will be crushed this week, so any bullish positions should take profits quickly.
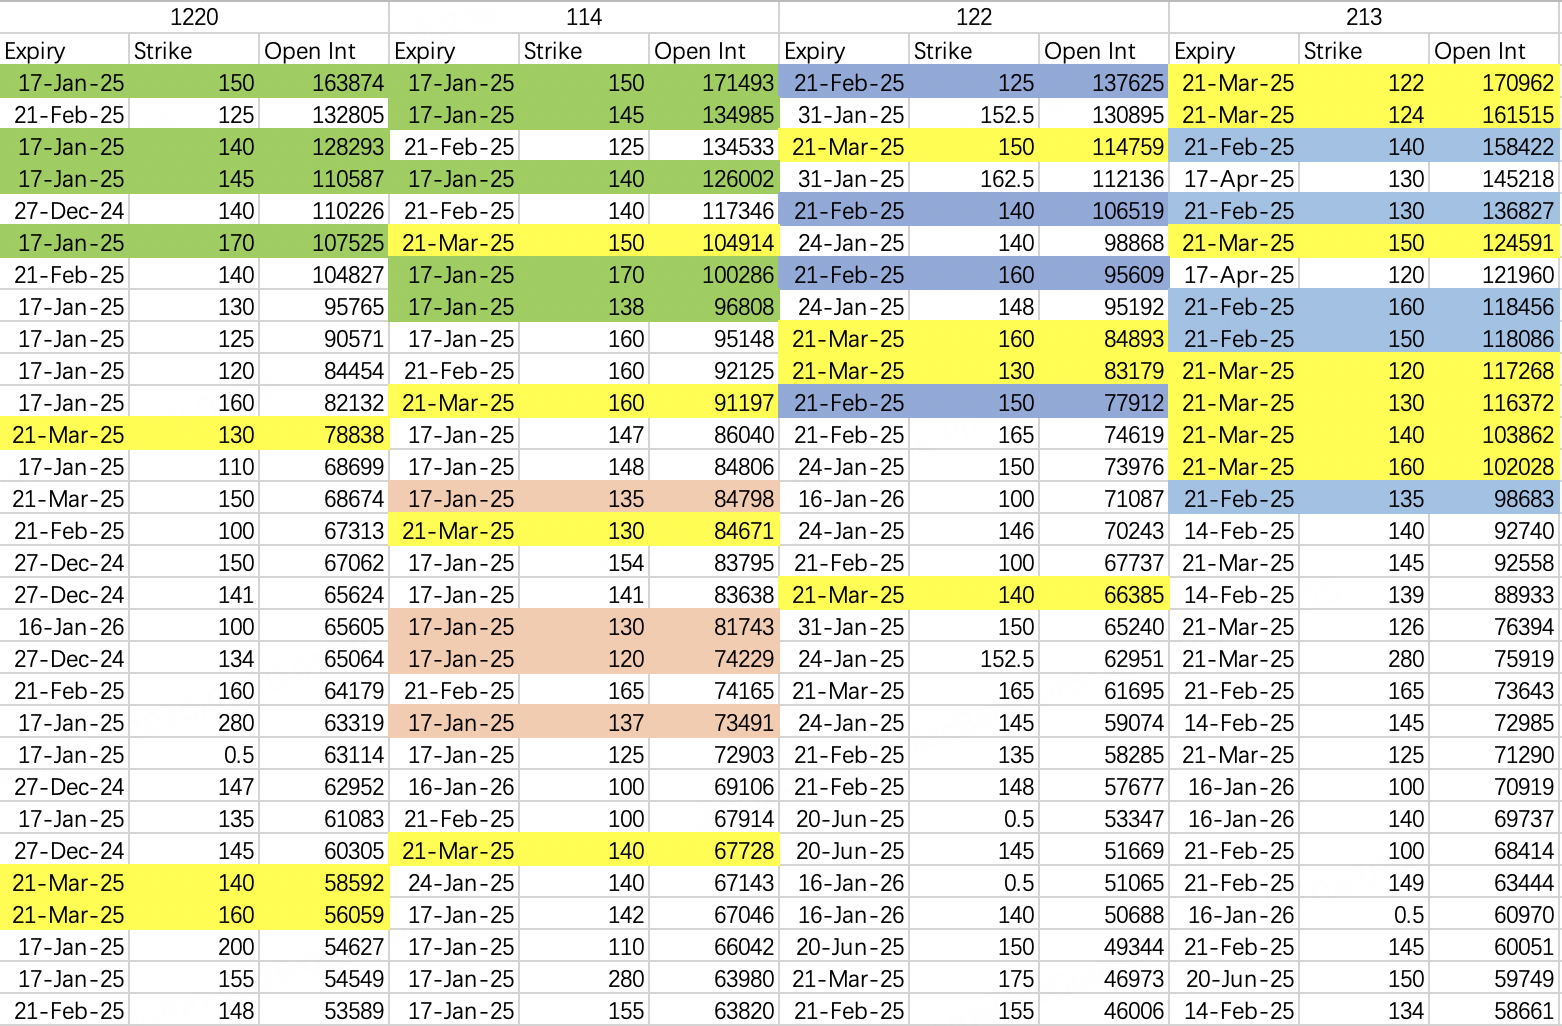
For the yellow data, the head OI strike prices are 122 and 124, which are the two positions opened by a wealthy trader. Theoretically, there’s no need to worry about the price pulling back to 122 just to crush the calls. If it’s the same wealthy trader who purchased earlier, they’ll likely close positions as soon as they incur losses, and the March head will shift to 150.
Disclaimer: Investing carries risk. This is not financial advice. The above content should not be regarded as an offer, recommendation, or solicitation on acquiring or disposing of any financial products, any associated discussions, comments, or posts by author or other users should not be considered as such either. It is solely for general information purpose only, which does not consider your own investment objectives, financial situations or needs. TTM assumes no responsibility or warranty for the accuracy and completeness of the information, investors should do their own research and may seek professional advice before investing.
