Precious Metals Caught in a Choppy Market: The Options Profit Strategy You Must Know
Recently, gold has been moving in tandem with the broader U.S. equity market, showing roller-coaster style swings that are hard to grasp in terms of timing and direction.
This analysis will briefly review the rhythm and patterns of gold price fluctuations from technical and fundamental perspectives, and then discuss how retail traders can use trading tools to capture these profit opportunities.
Based on a combination of current price structure and capital-flow signals, gold is still likely to probe lower repeatedly in the short term, and this round of correction has not yet fully run its course. However, from a longer-term cyclical perspective, the current gold bull market is far from over, and the potential upside remains significant.
4000-dollar level: short-term support may not hold at once
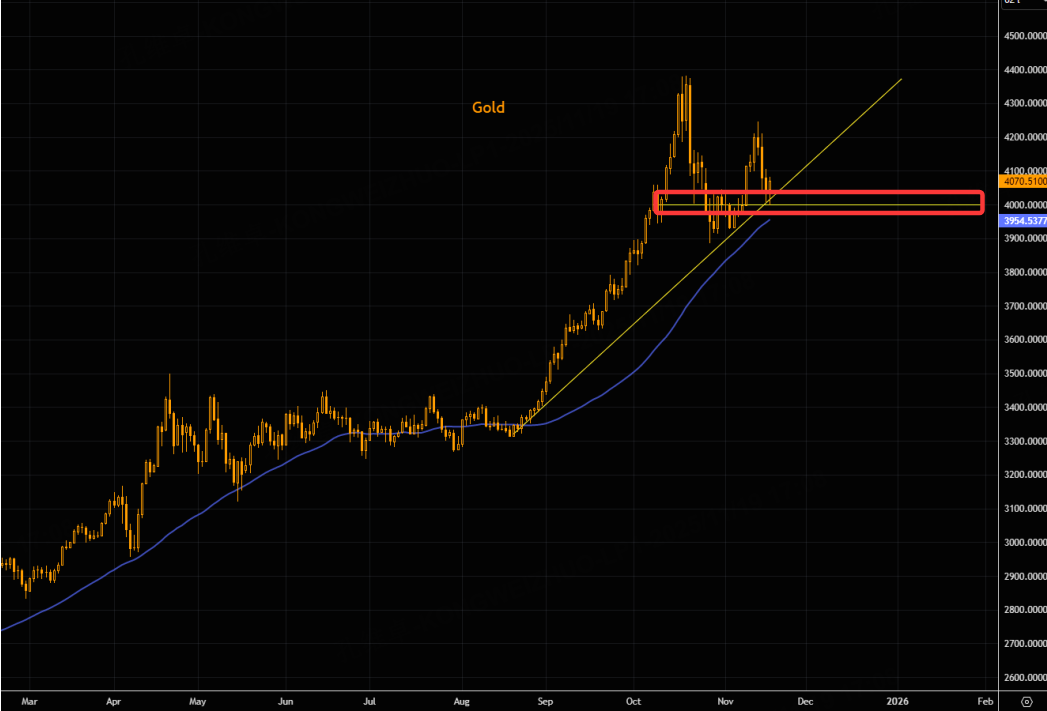
At present, gold prices have repeatedly found support around the 4000-dollar-per-ounce level and have once again rebounded from this strong support area, underscoring the importance of this price in the current cycle.
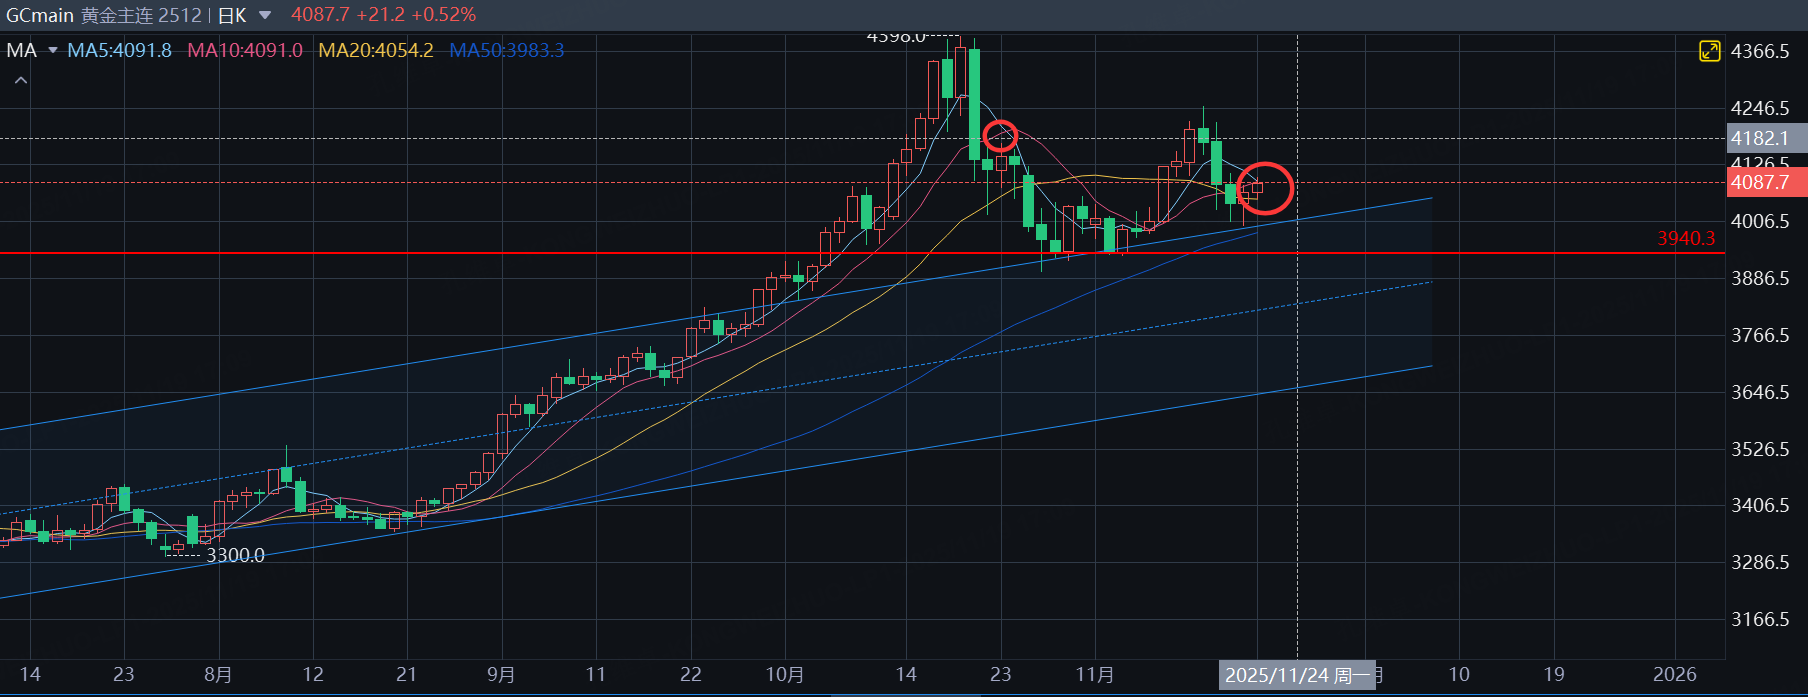
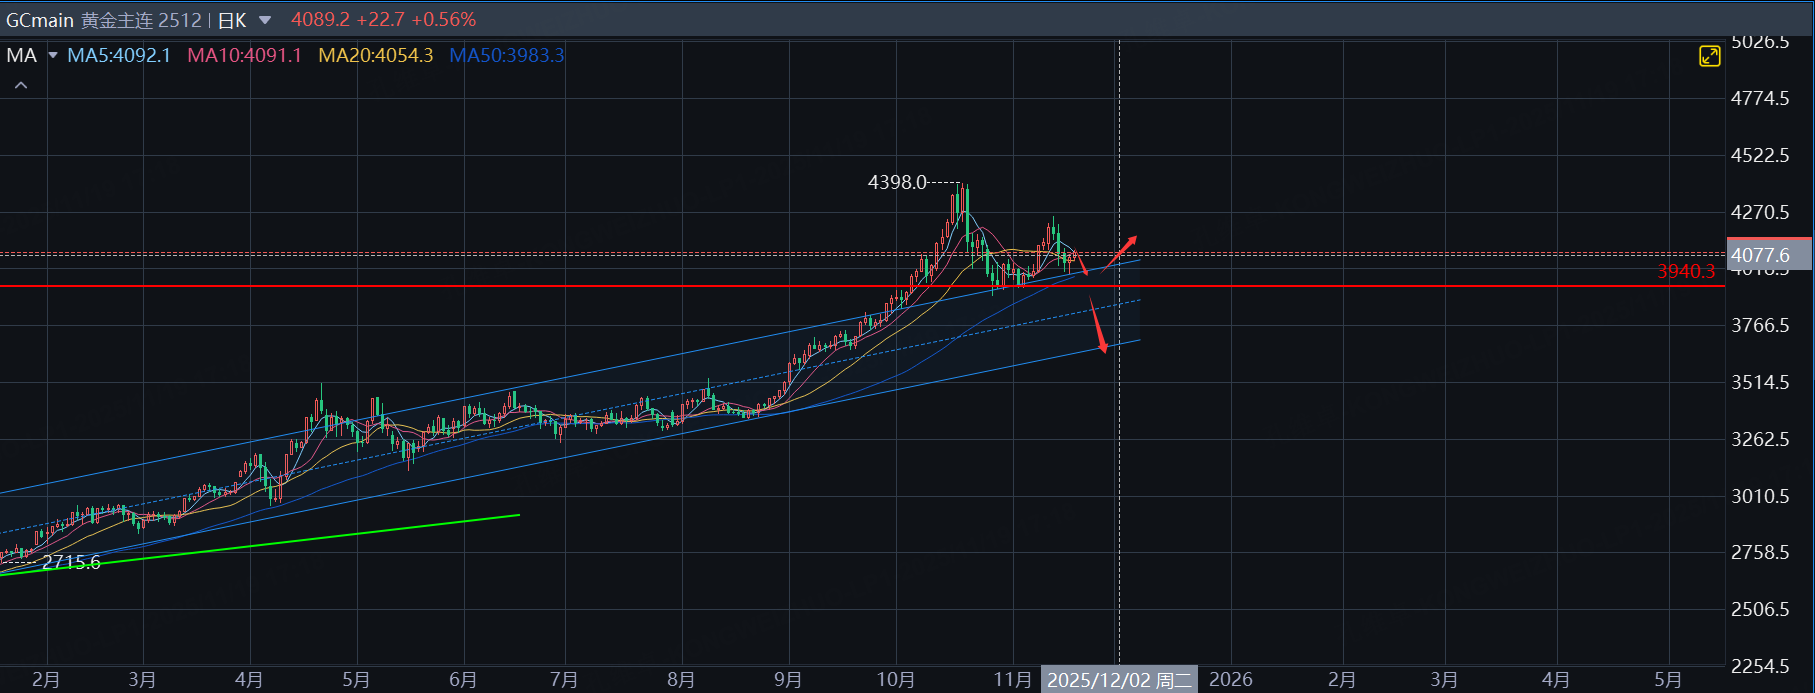
On the futures side, the short-term trendline for gold futures is clearly sloping downward and is very close to the 4000 area, while the 50-day moving average remains slightly below the current price, and technically the 5-day average has once again formed a bearish death cross with the 10-day average, indicating that the short-term technical pattern is still suppressive rather than fully repaired
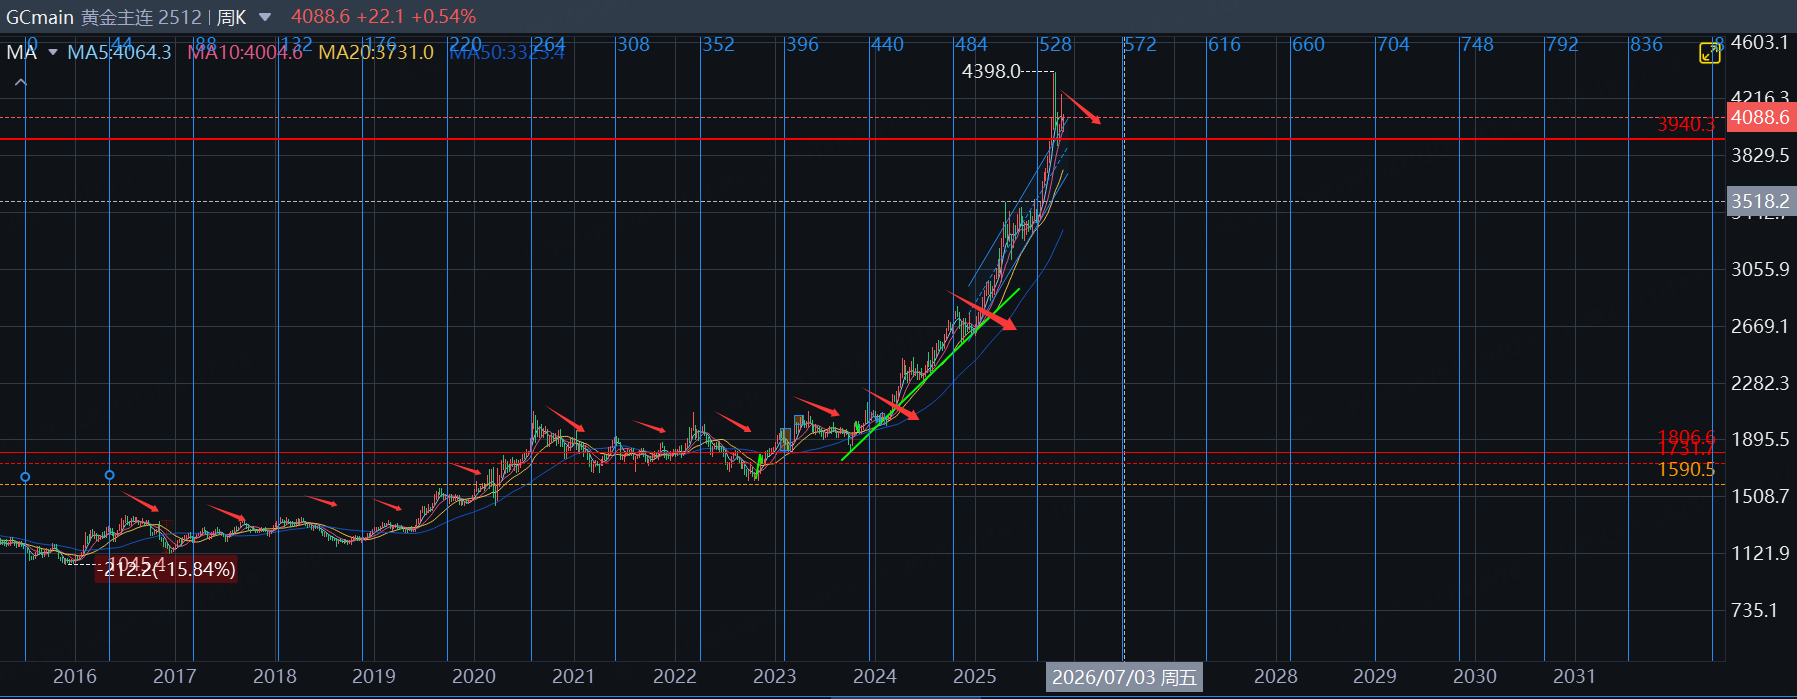
Looking at the weekly chart of the main gold futures contract, the overall pattern still leans toward a corrective structure rather than a impulsive uptrend. Comparing the magnitude and duration of previous corrections, the current adjustment appears more consistent with a correction that has not yet completed
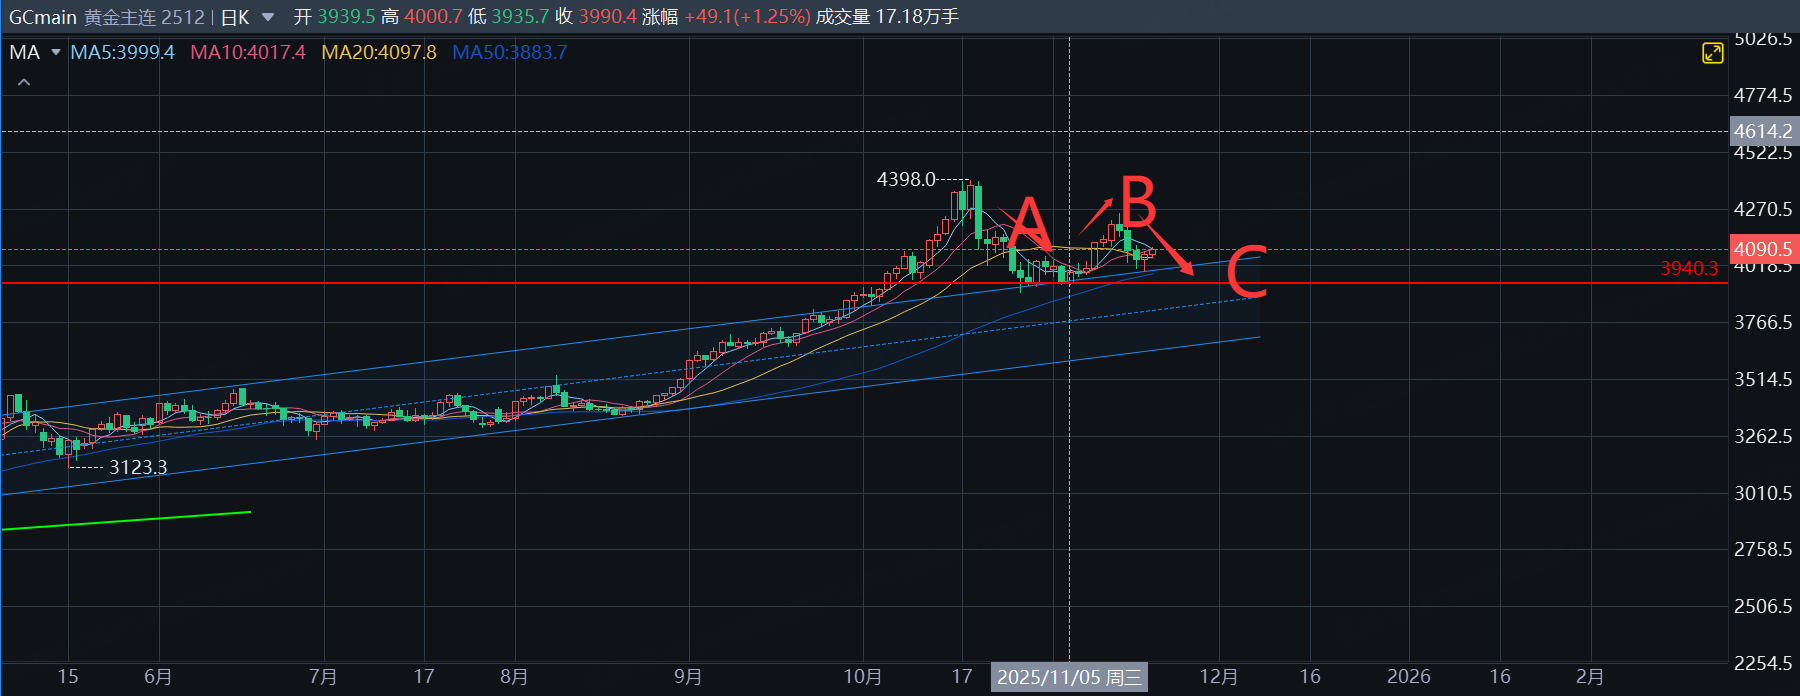
From the perspective of the daily price structure, the current rebound looks more like a technical retracement of the prior decline, rather than the starting point of a new, low-resistance, one-way rally. In technical terms, it more closely resembles the start of a new wave C sell-off, so in the short term traders still need to be cautious about the downside force of gold.
Therefore, traders still need to wait patiently for gold to show a clear technical stabilization around the 4000-point area, and to combine that with signs that the current liquidity-crisis risks in the broader market have eased, before making a higher-conviction judgment that gold has reversed and resumed an upward trend.
ETF flows: lack of powerful confirmation
From the perspective of ETF holdings and capital flows, the rebound from around 3900 dollars is clearly lacking the strong characteristic of “synchronous resonance between price and capital.” Although gold has rebounded from approximately 3900 dollars per ounce, outflows from gold-related ETFs have only slowed, and compared with the strong buying seen from August to October, net inflows into these ETFs remain quite small.
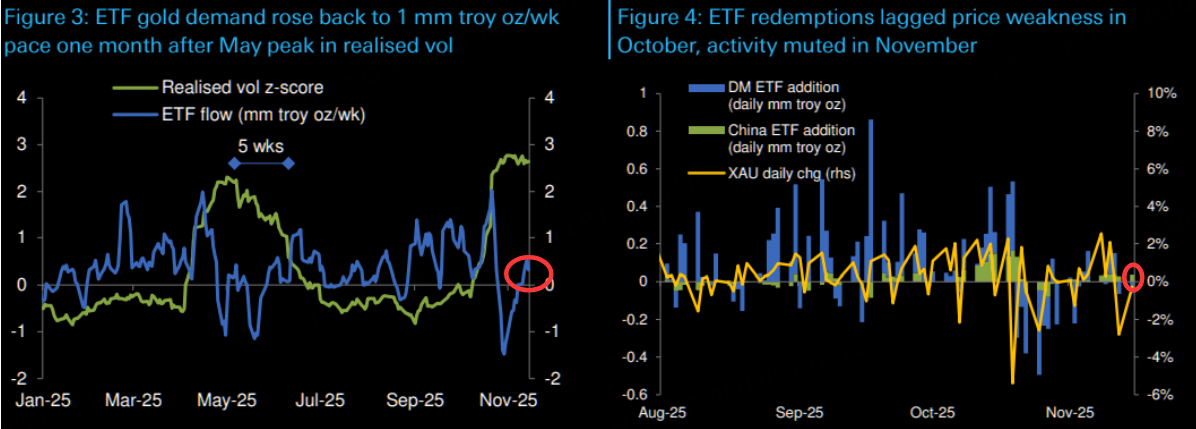
This implies that, at the capital level, there is a clear lack of follow-through and conviction behind the current rebound, which in turn weakens the sustainability of the short-term upward move in gold.
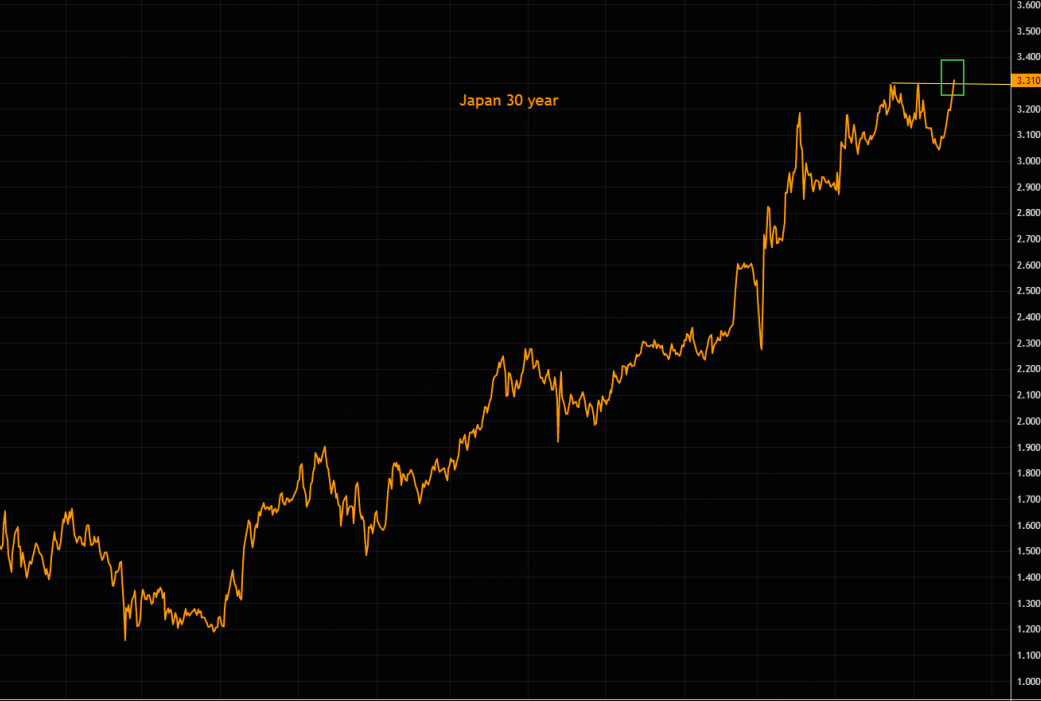
Japan 30-year yield above 3.3%: structural support for gold
The chart of Japan’s 30-year government bond yield shows that the yield index has closed above the high level of 3.3% and has completed what is, in technical terms, a breakout.
When gold prices are plotted on the same chart as the Japanese 30-year yield, it is evident that the two have fit closely over the long run, but that their short-term spread has recently widened significantly.
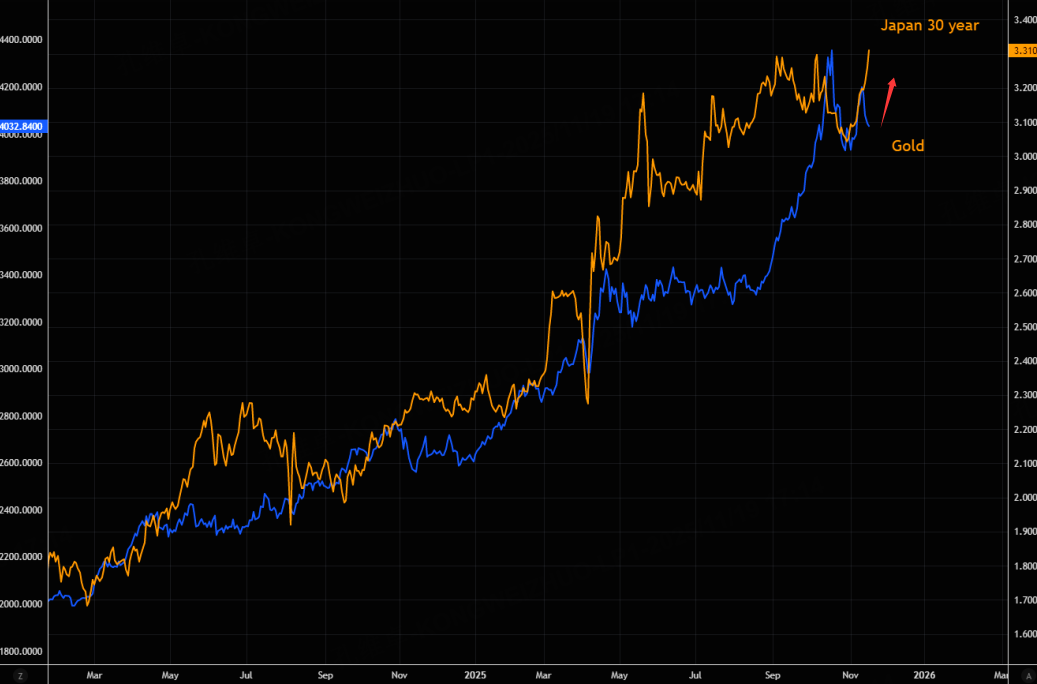
Historically, all else equal, a sustained rise in Japan’s 30-year government bond yield index has often been favorable for gold’s upside.
The underlying market mechanism is that higher long-term Japanese yields both reflect expectations for further tightening of domestic monetary policy and tend to shock global risk appetite and asset-pricing logic, thereby indirectly boosting demand for allocations to safe-haven assets such as gold
At the same time, the path of Japan’s 30-year yield has exhibited a high degree of fit with the VIX index, implying that rising long-term Japanese yields may trigger greater market volatility, which in turn can stimulate further upside in gold.
Recently, the Bank of Japan has clearly indicated that it still has plans to continue raising interest rates, and this communication has been an important catalyst driving the sustained rise in long-term Japanese bond yields
Long-term view: the gold bull market may only be halfway
From a longer-term perspective, supported by long-term momentum structures and multi-year relative-performance patterns, both gold and silver are in the midst of a major, long-duration uptrend. Among the most compelling signals is the chart of gold priced relative to the S&P 500 index.
Earlier this year, the gold/S&P 500 relative-value ratio retreated to a long-term support level, but then quickly rebounded. The implication is that, after a period of strong gains, gold has not entered a phase of systematic collapse in relative performance; instead, it has regained recognition from capital at a key support zone.
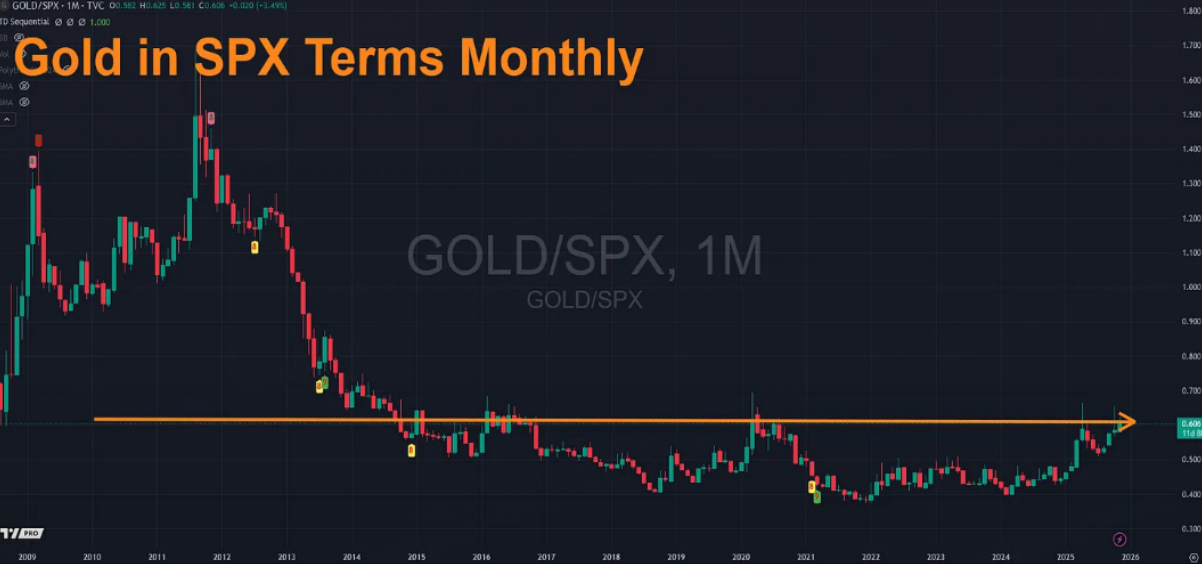
Therefore, if U.S. equities do not experience a sharp, large-scale crash, gold itself is also unlikely to undergo a “collapse-style” sell-off. The higher-probability scenario is that gold will move in a relatively limited range, undergoing a weak and choppy correction rather than a full-blown breakdown.
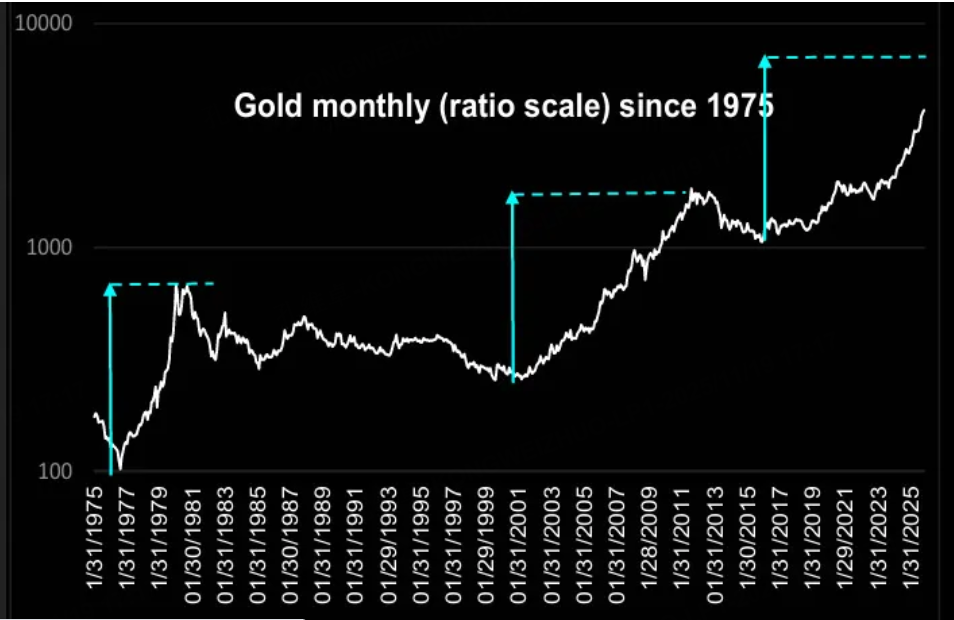
Extending the horizon further, one can compare the current cycle with previous bull-market cycles in gold since its legalization in 19751975. In each of the prior two complete cycles, gold rose from its bear-market low to its bull-market peak by roughly a factor of about 8.
By contrast, in the current cycle that began from the 2015 low, gold has, up to now, risen only about 4 times from its trough near 1050 dollars in 2015. This suggests that the current phase in gold is more akin to a consolidation before a larger upside move in a broader, ongoing bull market
How to trade the current gold setup: three methods
Given this backdrop, how can traders capture the current trading opportunities in gold? This analysis suggests three approaches.
First, in the futures market, one can adopt an intraday trading style with tight take-profit and stop-loss levels and quick in-and-out execution.
When gold futures break below the 20-day moving average, a short-term bearish stance can be taken, targeting the 4000-point support area as a take-profit level. If gold subsequently breaks below the 4000-point level again, one can re-establish short positions; after losing the 4000-point support, gold futures may retest the 3700 level or even the 3600 level.
Second, still in futures, one can use a “long gold, short silver” hedging strategy. After gold breaks below the 20-day moving average and the short-term view turns bearish, a trader can short one micro silver futures contract while going long two micro gold futures contracts. Because in precious-metals downturns silver typically falls faster than gold, this spread can be used to capture more stable, directional bearish profits; however, this strategy requires closing positions promptly once gold rebounds back above its 2020-day moving average.
Third, in the options market, traders can exploit the characteristics of futures options to construct a bearish spread strategy on gold – specifically, a bear put spread.
This can be done by buying put options on gold futures at higher strike prices after a rebound and selling put options on gold futures around the 4000-point level to form a spread. If a trader does not have access to futures options, the GDX ETF can be considered as a substitute underlying.
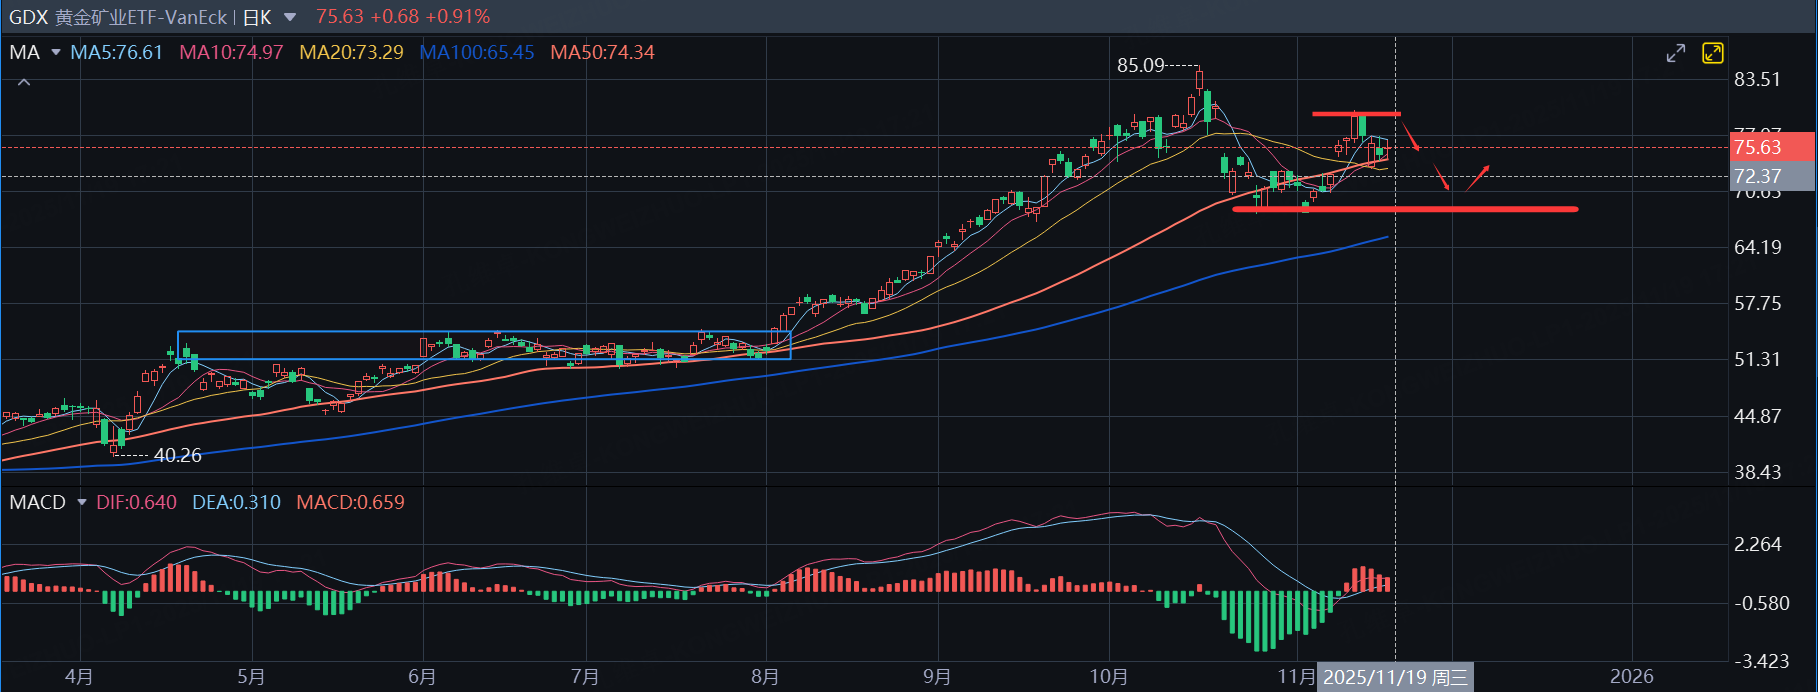
For example, on GDX, the gold-miners ETF, an options-chain simulation shows a bear put spread structure in which the trader buys one GDX put option with a strike price of 79 dollars and sells one GDX put option with a strike of 68 dollars. In one such scenario, with the underlying breakeven GDX price around 74 dollars,
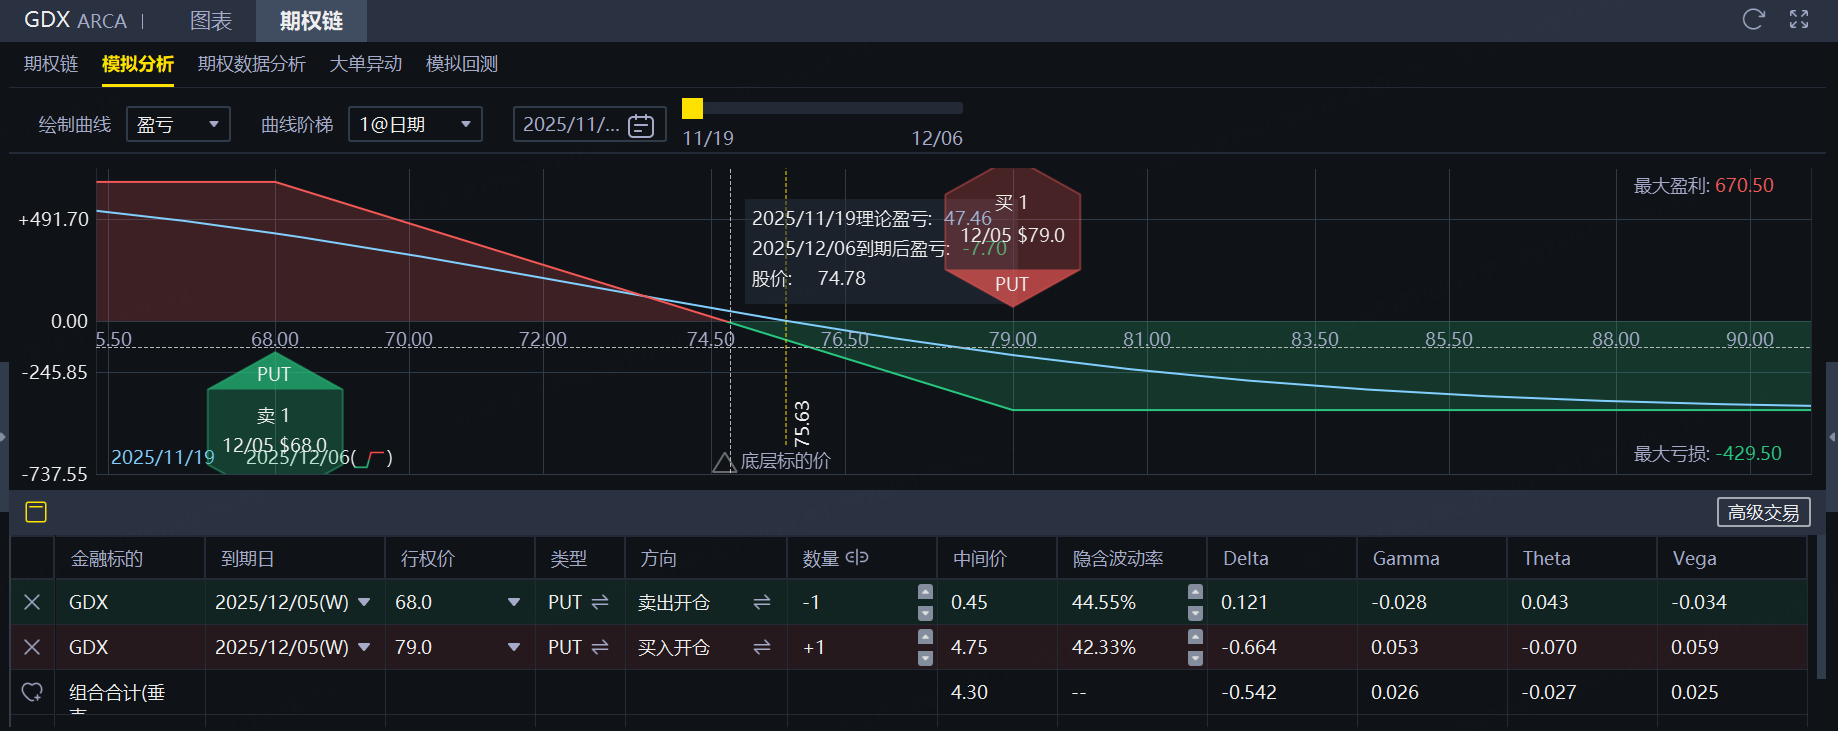
From the payoff curve, one can see that the breakeven point for this GDX bear put spread is around 74 dollars, which coincides roughly with the 20-day moving average of GDX at that time. This means that as long as GDX falls below its 20-day moving average in the future, this bear put spread structure is expected to generate profit,At the same time, the maximum loss on this spread strategy is also controllable。
$NQ100指数主连 2512(NQmain)$ $SP500指数主连 2512(ESmain)$ $道琼斯指数主连 2512(YMmain)$ $黄金主连 2512(GCmain)$ $白银主连 2512(SImain)$
Disclaimer: Investing carries risk. This is not financial advice. The above content should not be regarded as an offer, recommendation, or solicitation on acquiring or disposing of any financial products, any associated discussions, comments, or posts by author or other users should not be considered as such either. It is solely for general information purpose only, which does not consider your own investment objectives, financial situations or needs. TTM assumes no responsibility or warranty for the accuracy and completeness of the information, investors should do their own research and may seek professional advice before investing.
- Megan Barnard·2025-11-21Isn’t $4k support stronger with ETF outflows slowing?LikeReport
- Jo Betsy·2025-11-21Won’t silver’s industrial demand break the “long gold/short silver” trade?LikeReport
- Ron Anne·2025-11-21GDX bear put spreads are genius for this choppy correction!LikeReport