Stuck in a Slow-Bleed Market? 3 Key Strategies to Watch
1. US Equities Outlook
$Invesco QQQ(QQQ)$ $NASDAQ(.IXIC)$ $E-mini Nasdaq 100 - main 2606(NQmain)$ $Micro E-Mini Nasdaq 100 - main 2606(MNQmain)$ $S&P 500(.SPX)$ $SPDR S&P 500 ETF Trust(SPY)$ $E-mini S&P 500 - main 2606(ESmain)$ $Micro E-mini S&P 500 - main 2606(MESmain)$
I undoubtedly remain bearish on the current trajectory of US equity indices. However, for those holding naked short positions or buying the VIX on dips, there are two massive risks that must be carefully managed:
Risk 1: The trajectory of the current US-Iran war remains uncertain. If news of a US-Iran peace agreement is confirmed, or if a major Eastern power steps in to mediate, US equities could experience a massive short-term surge. Holding naked short positions without strict stop-losses, or failing to construct bear-spread option strategies to capture downside gains, could result in severe short-term losses.
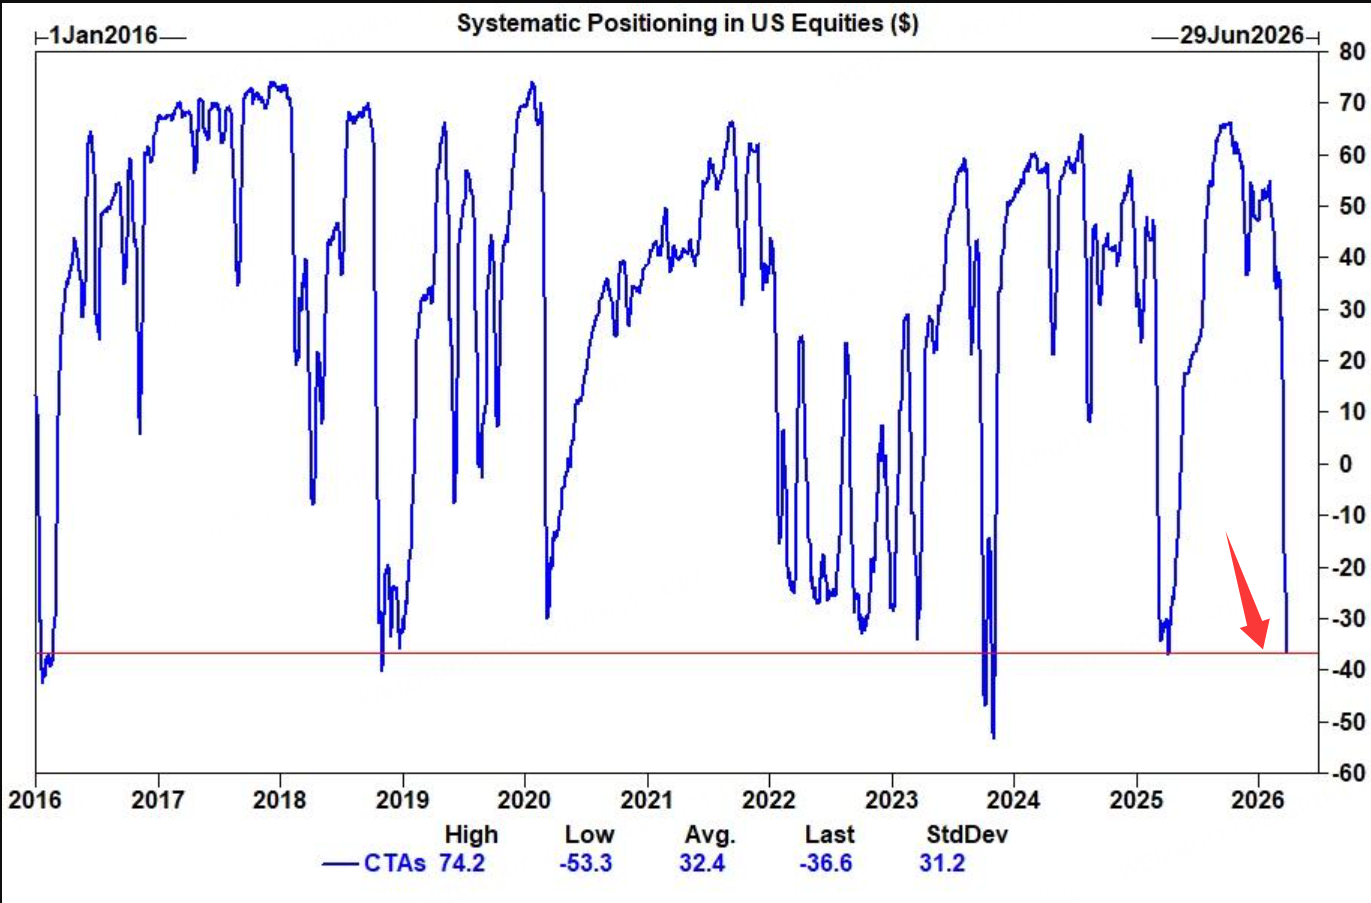
Risk 2: CTA funds have finished selling off their US equity positions, and their upward convexity is currently extremely high. Consequently, any positive news would spark tremendous rebound momentum. CTA funds have heavily dumped US stocks, bringing their positions to historical lows, making their convexity highly bullish right now.

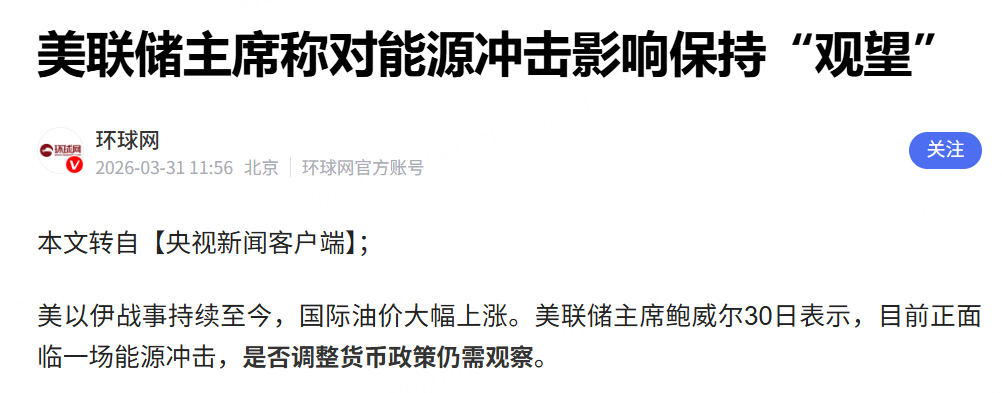
Furthermore, Federal Reserve Chair Jerome Powell’s latest remarks have slightly moderated market expectations for future rate hikes. According to a recent report citing CCTV News, Powell stated that the US is currently facing an energy shock driven by the ongoing US-Israel-Iran conflict and soaring international oil prices, adding that the Fed will remain in a "wait-and-see" mode before adjusting monetary policy.
$Cboe Volatility Index(VIX)$ $Invesco QQQ(QQQ)$ $NASDAQ(.IXIC)$ $E-mini Nasdaq 100 - main 2606(NQmain)$ $Micro E-Mini Nasdaq 100 - main 2606(MNQmain)$ $E-mini S&P 500 - main 2606(ESmain)$
Meanwhile, high-yield bonds have successfully rebounded at their critical 200-day moving average. Typically, if the 10-year US Treasury yield surges by 2 standard deviations within a single month, the market struggles to digest the move, triggering a sharp correction. This critical threshold sits precisely at the 4.45% level.
$Invesco DB US Dollar Index Bullish Fund(UUP)$ $Cboe Volatility Index(VIX)$ $ProShares VIX Short-Term Futures ETF(VIXY)$
$Micro 10-Year Yield - main 2604(10Ymain)$ $iShares iBoxx $ High Yield Corporate Bond ETF(HYG)$
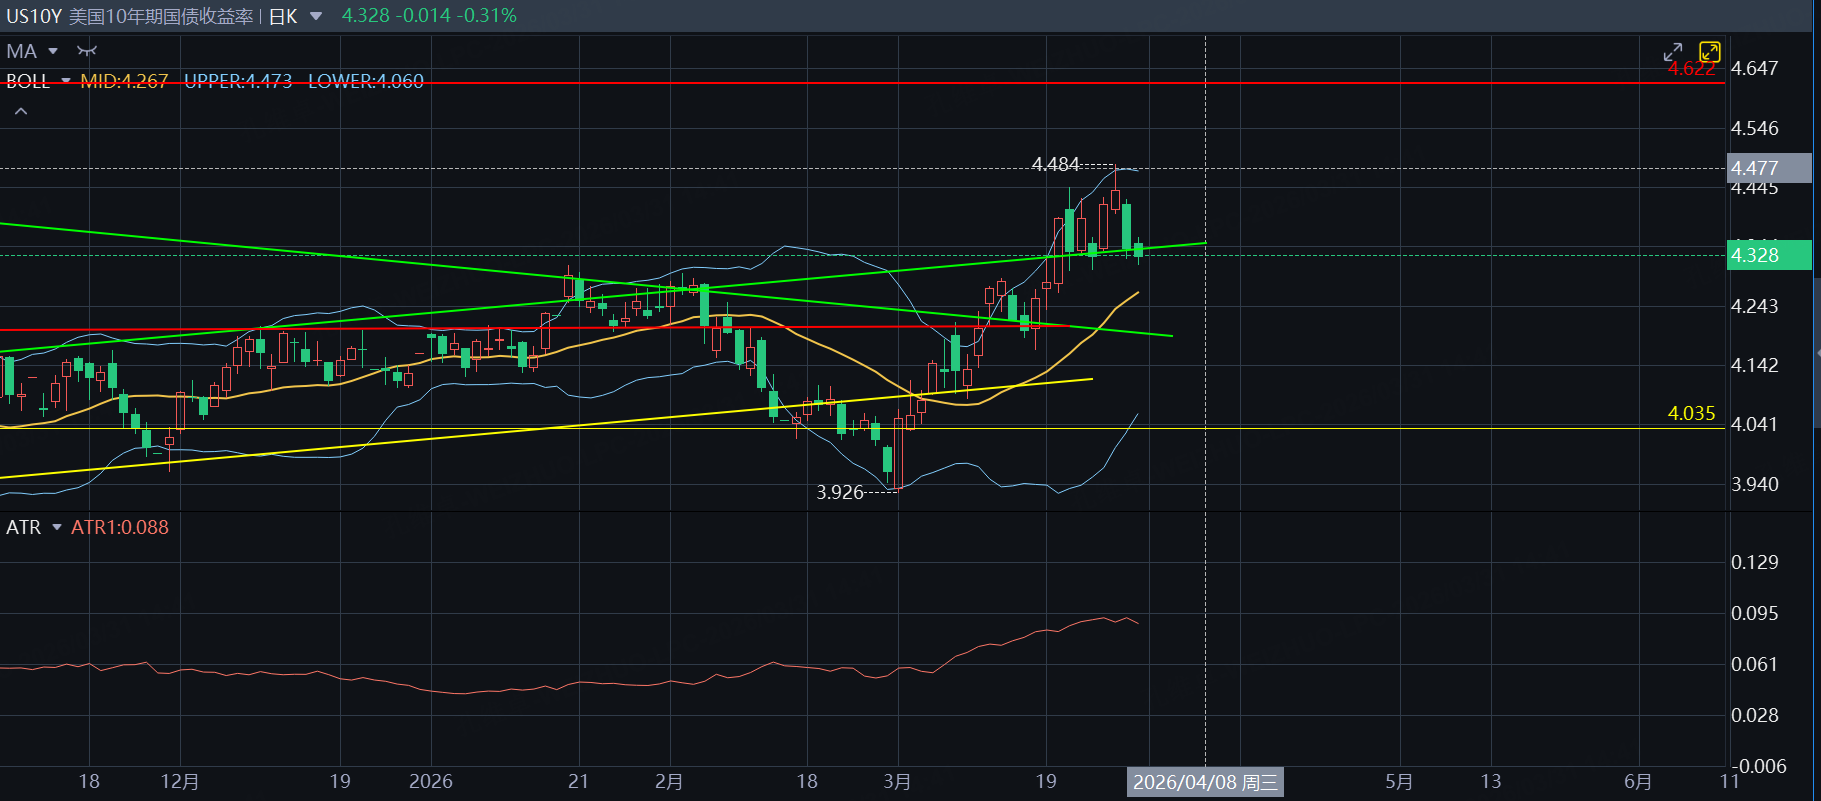
This implies that had Powell not intervened verbally, and highly sensitive Treasury yields continued to climb, the market would have highly likely accelerated its decline. Because Powell eased rate hike fears overnight, US equities initiated some short-covering today, though the overarching bearish trend remains intact.

According to my technical model, the S&P 500 has broken below the critical support at the red line. Establishing short positions at this red line currently offers a favorable risk-to-reward ratio. A strict stop-loss should be triggered if the price breaks back above this red line, with an anticipated downside target dropping to 6,165.
As I mentioned earlier, US equities are nearing the late stages of a bearish trend and are awaiting positive catalysts. If genuine positive news emerges—such as a confirmed US-Iran agreement and a verified ceasefire—the market will highly likely experience a sharp rally, terminating the recent slow bleed.
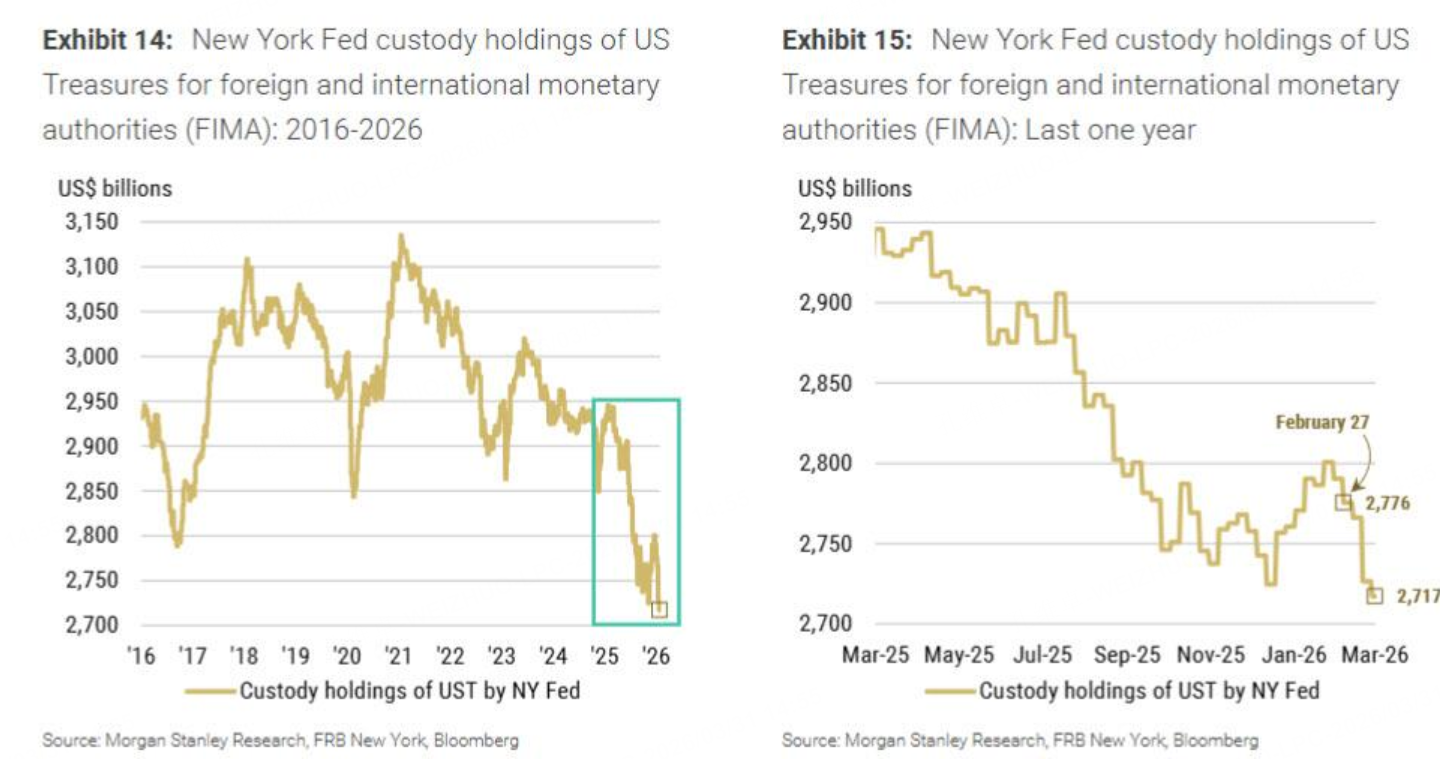
Conversely, if peace talks remain unconfirmed and the stalemate drags on past April 6 (the deadline set by Trump to end the war), market patience will be exhausted. Major global players—including India, Russia, China, and Middle Eastern nations—may continuously dump gold and US Treasuries to acquire liquidity for purchasing resources. In that scenario, Treasury yields would climb higher, and gold would fall further.
Notably, foreign holdings of US Treasuries have plummeted since the onset of the US-Iran war.
In summary, everything hinges on the direction of the news flow. Until news of a resolution materializes, I remain consistently bearish on US equities. Beyond the aforementioned naked short futures strategy, I will consider selling 5-day S&P call options above the 20-day moving average to harvest time value. Stop-losses must be executed immediately if prices break above the red line in the technical model. Please keep in mind that April 6 is the critical deadline for confirmed peace negotiation news.
2. Gold Outlook
$Gold - main 2606(GCmain)$ $E-Micro Gold - main 2606(MGCmain)$ $1-Ounce Gold - main 2606(1OZmain)$
Gold's sensitivity to shifts in the US-Iran war is exceptionally high, mirroring that of US equities. The moment a peace settlement is announced, gold and silver will very likely spike in the short term. As the charts indicate, gold is currently fluctuating at the lower bound of its trading range, forming a bottoming structure.
$Silver - main 2605(SImain)$ $E-mini Silver - main 2605(QImain)$ $Silver - Mar 2026(SI2603)$ $iShares Silver Trust(SLV)$
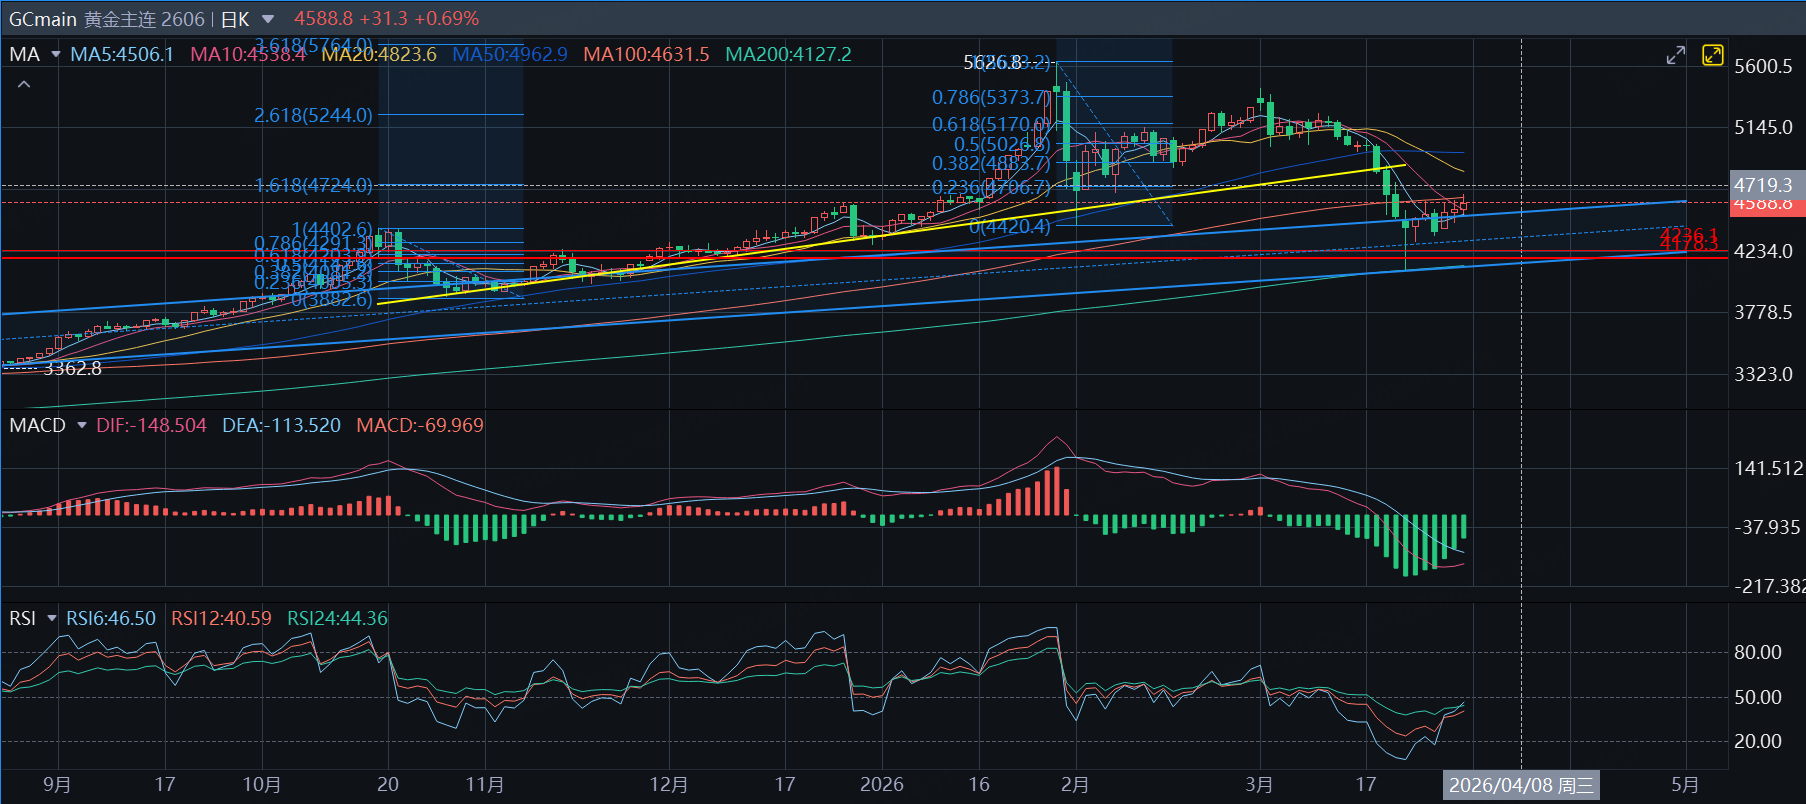
We cannot easily adopt a bullish stance on gold unless it breaks above its 20-day moving average. Gold is currently the preferred asset to liquidate for liquidity; regions like the Middle East and Asia—particularly Russia and India—are aggressively selling gold to replenish their strategic resource reserves and guard against the risks of long-term supply chain disruptions. Therefore, unless the US-Iran war ends, it is hard to say whether gold can continue to rise.
From a technical perspective, a breakdown below the red line could accelerate gold's decline. However, as long as this red line holds and the war does not escalate, gold has reached the lower end of its range based on historical momentum, making it viable to gradually buy the dip.
If gold breaks above the 20-day moving average, it technically signals a continued upward move to retest the previous high of 5,600. Conversely, a breakdown below the 4,200 red line could trigger a test of the 3,600 low. You can formulate your trading strategies using these reference points.
For instance, you might chase the rally if it breaks above the 20-day moving average and strictly stop out if it falls below. Alternatively, consider structuring a bull option spread. In the short term, gold is expected to stage a rebound before retesting lows from a higher elevation.
3. Euro Outlook
Currently, the Euro is facing severe overhead resistance from its 5-week moving average.
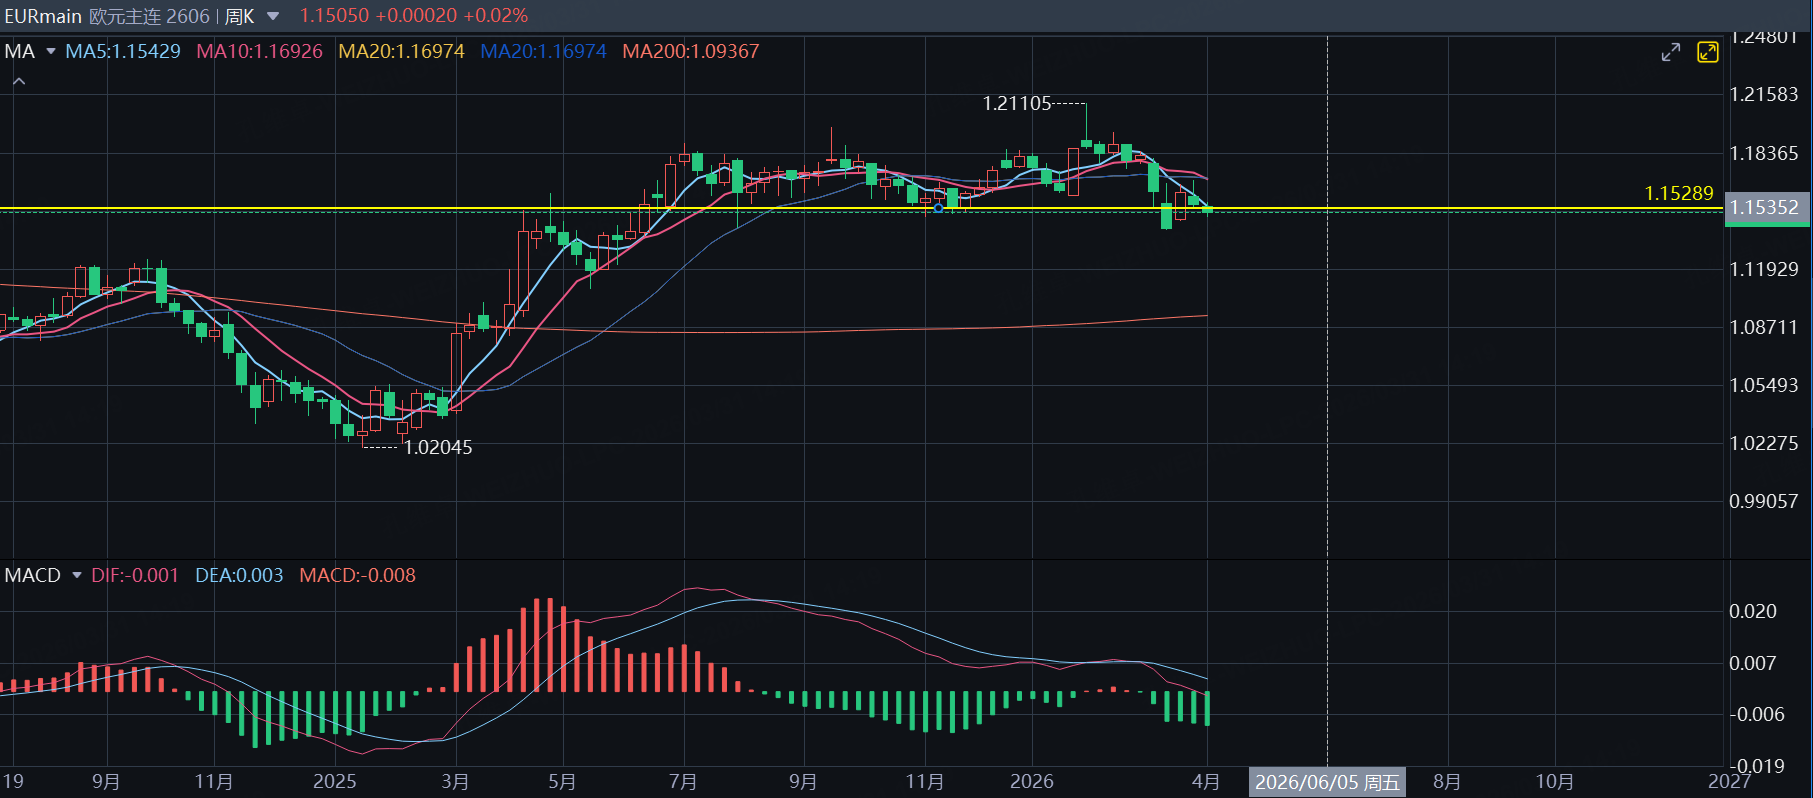
We are waiting for the weekly close; if the weekly candlestick closes below the yellow support line for two consecutive weeks, the short-to-medium-term bearish trend for the Euro will be overwhelmingly strong.
For now, you can follow the 5-week moving average to attempt shorting the Euro or Micro Euro. If it breaks above the 5-week moving average, execute an immediate stop-loss. Once there is definitive news of a US-Iran resolution, completely abandon the Euro shorting strategy immediately.
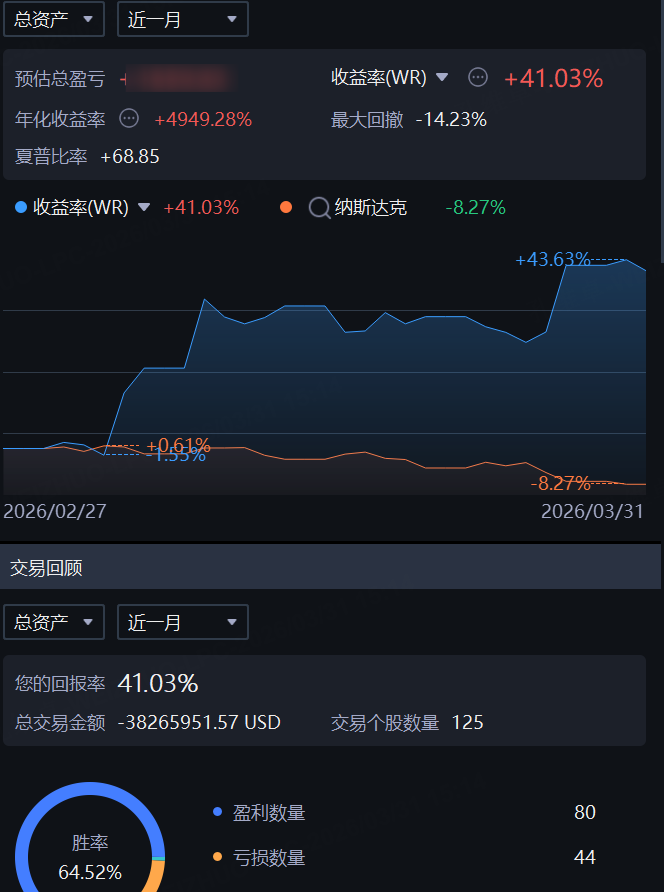
4. Portfolio Performance Review
Finally, attached is a breakdown of my recent performance. My returns over the past month were derived from: rolling short SPY call options, buying the VIX at lows, shorting gold, and going long on crude oil spreads.
$Euro FX - main 2606(EURmain)$ $Japanese Yen - main 2606(JPYmain)$
Disclaimer: Investing carries risk. This is not financial advice. The above content should not be regarded as an offer, recommendation, or solicitation on acquiring or disposing of any financial products, any associated discussions, comments, or posts by author or other users should not be considered as such either. It is solely for general information purpose only, which does not consider your own investment objectives, financial situations or needs. TTM assumes no responsibility or warranty for the accuracy and completeness of the information, investors should do their own research and may seek professional advice before investing.
