$Global X Nasdaq 100 Covered Call ETF(QYLD)$ 🐱 Blink Fans | Why I Bought QYLD: Understanding Its Components, Monthly Income Strategy and Technical Analysis
My latest trade: I bought QYLD at US$17.87 on 31 October 2026.
I have been looking at the Nasdaq 100 and considering how I want to position my portfolio. Although I remain bullish on technology stocks, I think QQQ is relatively expensive at current levels. Rather than putting all my capital into QQQ, I prefer to accumulate QYLD gradually while waiting for a bigger correction.
What interests me about QYLD is its covered-call strategy. It gives me exposure to the Nasdaq 100 while generating option premiums, which support its income distributions.
However, I also want to understand exactly what I am buying. QYLD is not simply a high-dividend ETF. Its underlying holdings, option strategy, distribution structure and technical chart all matter.
Let’s break it down.
1️⃣ Why am I making this trade now?
📈 Why I am choosing QYLD instead of chasing QQQ
My long-term view on technology remains positive.
The Nasdaq 100 contains some of the world’s largest technology and growth companies. Artificial intelligence, cloud computing, semiconductor development and digital advertising are industries that I believe will continue creating investment opportunities.
However, there is a difference between liking an investment and liking its current entry price.
When QQQ has already climbed significantly, I don’t want to chase it with all my available capital. I would rather wait for a correction and accumulate at more attractive valuations.
In the meantime, QYLD offers a different investment approach.
I am interested in its option-income strategy because I can gain exposure to the Nasdaq 100 while collecting distributions, although these distributions are variable and do not guarantee a positive total return.
My thinking is simple:
* QYLD is my income-oriented Nasdaq position.
* QQQ is my long-term growth accumulation target.
* Cash gives me flexibility when the market corrects.
I don’t need to choose only one investment. I can give each ETF a different role in my portfolio.
🧩 Understanding the components of QYLD
Before buying an ETF, I want to understand what is inside it.
QYLD is managed by Global X. Its objective is to track the performance of the Cboe Nasdaq-100 BuyWrite V2 Index before fees and expenses. It combines Nasdaq 100 equity exposure with a systematic covered-call strategy. Global X ETFs +1
1. Technology stocks – the biggest component
QYLD has significant exposure to the technology sector.
Some of its important holdings include:
Company Ticker What it does
NVIDIA NVDA AI chips and computing
Apple AAPL Consumer technology
Microsoft MSFT Cloud and software
Micron MU Memory semiconductors
Amazon AMZN E-commerce and cloud
AMD AMD Processors and AI chips
Alphabet GOOGL Google and AI
Meta META Social media and AI
Tesla TSLA Electric vehicles and technology
Broadcom AVGO Semiconductor and infrastructure software
These are among the major holdings reported around October 2026. Holdings and weights change over time. StockAnalysis.com +1
This is one reason I find QYLD interesting. I am not buying an ETF that depends on one individual company. I am getting exposure to a basket of large Nasdaq-listed businesses.
2. Sector diversification
Although QYLD is heavily associated with technology, it has exposure to several other sectors.
The reported sector breakdown around the end of October 2026 was approximately:
Sector Weight
Information technology 58.5%
Communication services 14.8%
Consumer discretionary 10.4%
Consumer staples 6.2%
Healthcare 4.6%
Industrials 3.1%
Utilities 1.1%
Materials 1.0%
Energy 0.5%
Financials 0.2%
Schwab Wall Street
The important point is that QYLD is still heavily concentrated in technology-related businesses. It is not a defensive, all-sector dividend ETF.
3. Covered-call options strategy
This is the most important component that makes QYLD different from QQQ.
QYLD holds Nasdaq 100 stocks and writes corresponding call options on the Nasdaq 100 Index.
Here is a simplified example.
Suppose the Nasdaq 100 is trading at 25,000 points.
The fund writes a call option and receives an option premium.
In exchange, it gives up some potential gains above the option strike price.
The premium collected helps generate income for the fund.
The strategy can be particularly interesting when the market moves sideways or experiences volatility.
However, there is a trade-off.
If the Nasdaq rises strongly, the fund may not participate fully in that upside. If the Nasdaq falls, QYLD can still lose value.
This is why I consider QYLD an income-oriented investment rather than a replacement for QQQ. globalxetfs.com +1
4. Monthly distributions
Another attraction is QYLD’s monthly distribution structure.
I like the idea of having a monthly cash distribution rather than relying entirely on selling shares to realise investment gains.
But I must be careful when looking at the yield.
A distribution rate is not the same as a guaranteed return. Some distributions may represent return of capital, and receiving cash does not necessarily mean my investment has increased in value.
I will therefore monitor:
* Monthly distribution amounts.
* Net asset value.
* Total return after distributions.
* The fund’s option strategy.
* The long-term performance of the underlying Nasdaq exposure.
The expense ratio is also important. QYLD’s published expense ratio is 0.60%. globalxetfs.com +1
📊 Technical analysis: Why did I buy QYLD yesterday?
Now let’s look at the daily chart.
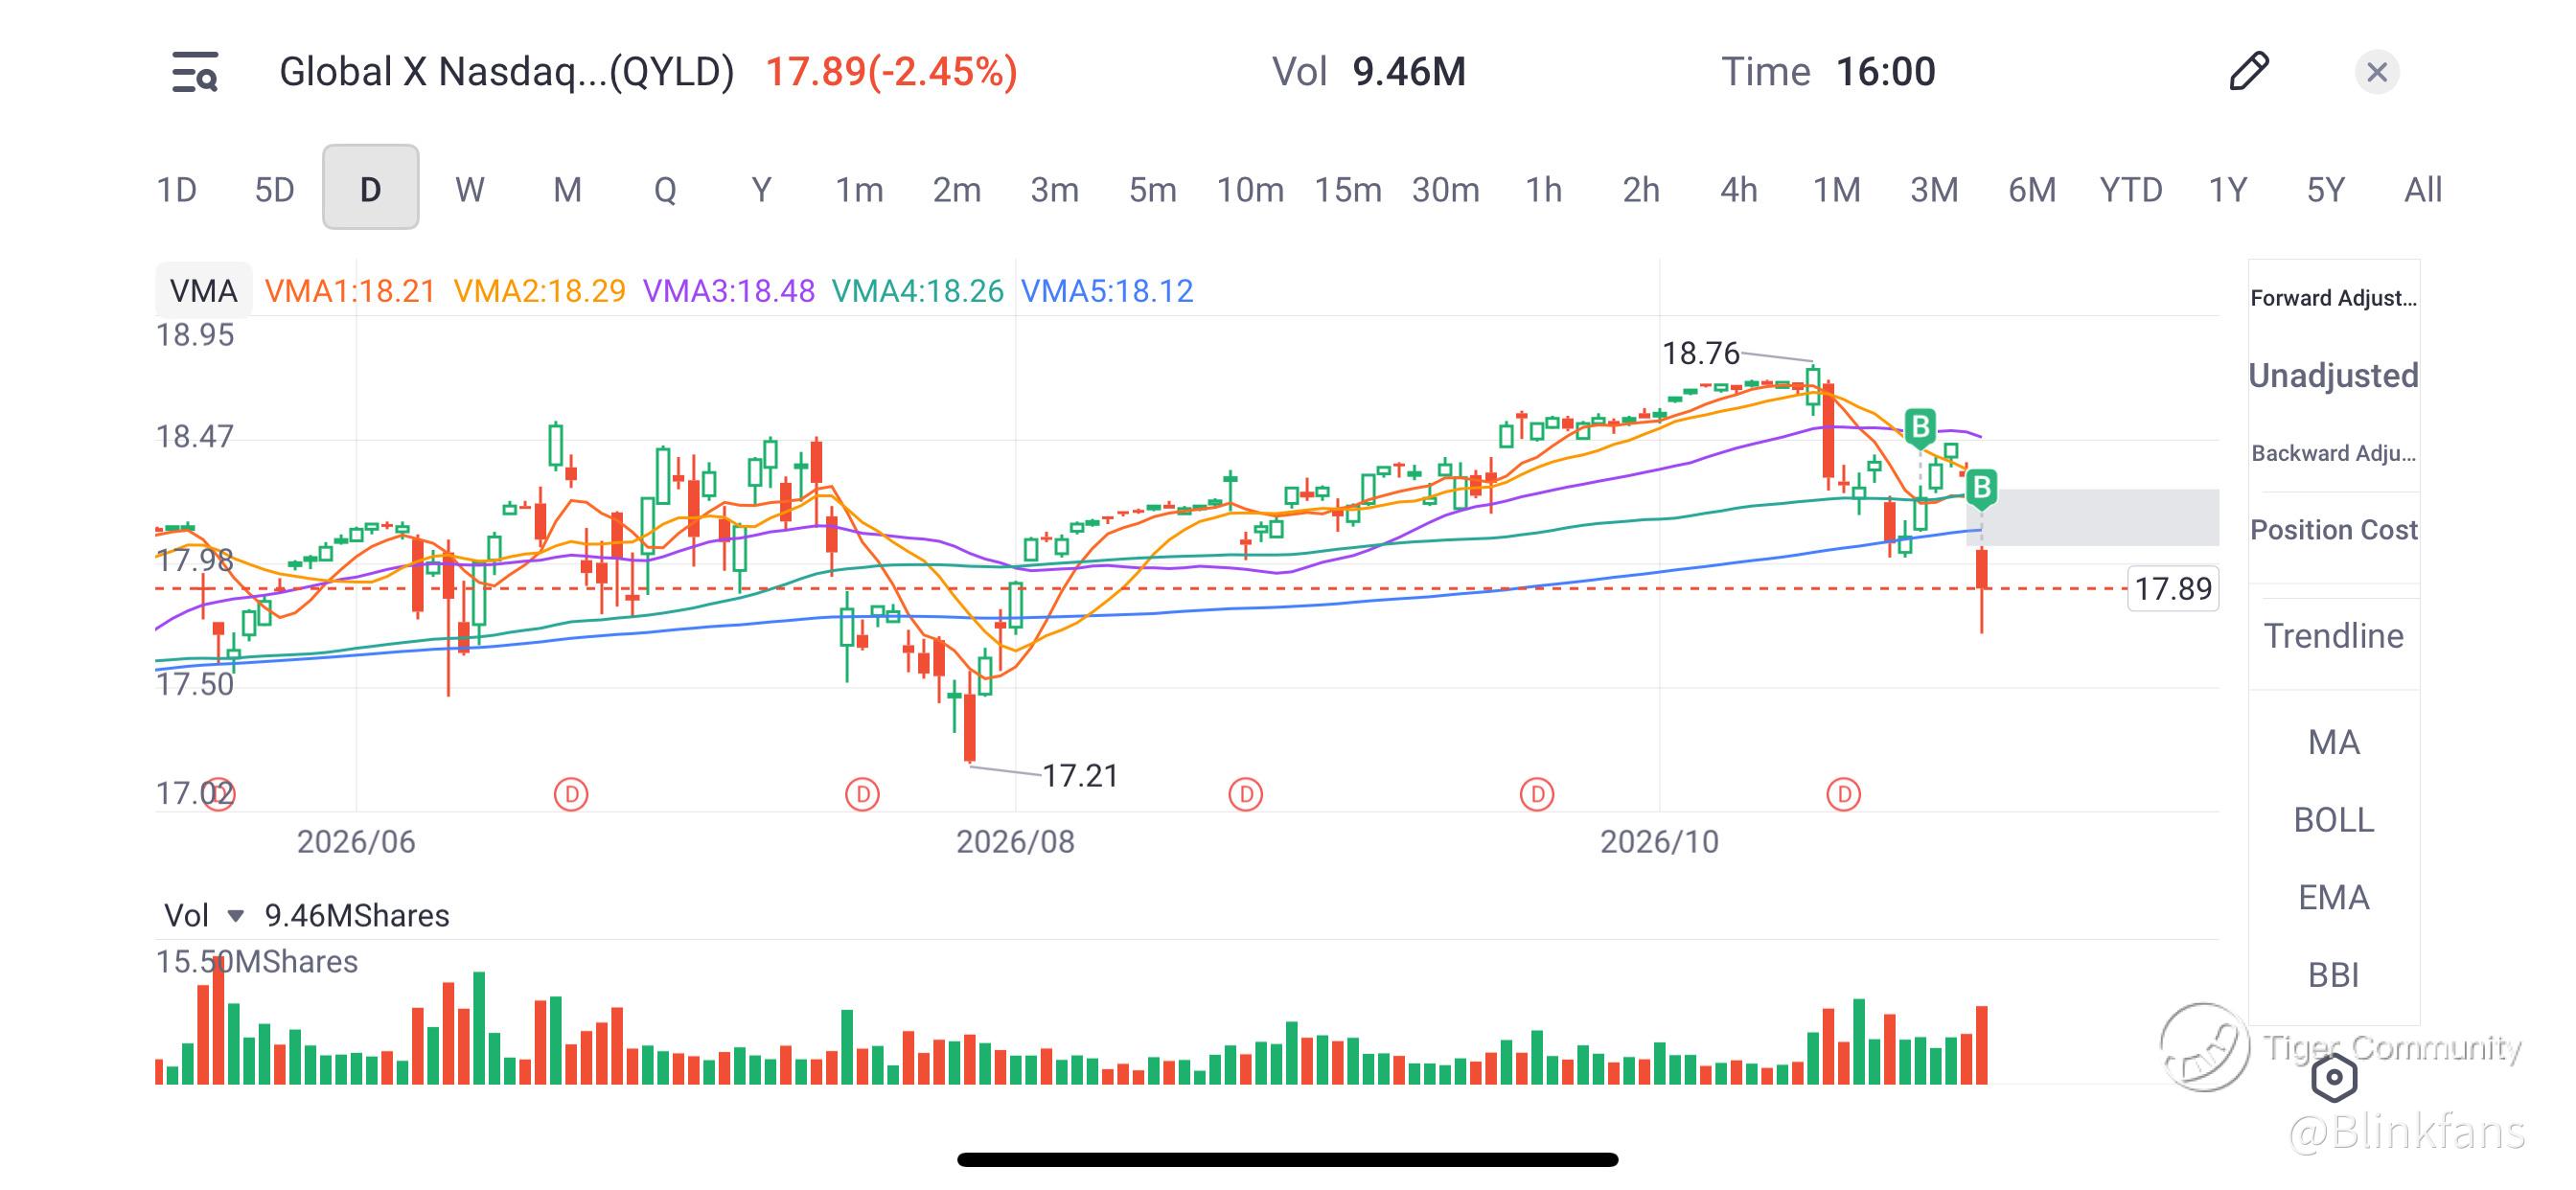
My purchase was around US$17.87. The chart shows a closing price of US$17.89, down 2.45%, with trading volume of approximately 9.46 million shares.
I noticed several things that made me interested in starting a position.
1. Price correction from US$18.76
QYLD previously reached approximately US$18.76 before experiencing selling pressure.
It subsequently pulled back towards US$17.89.
I am interested because the price has corrected from its recent high, giving me an opportunity to accumulate at a lower level.
However, I don’t automatically assume that every price decline is a buying opportunity. I want to see whether selling pressure starts slowing down.
2. Moving averages: Price is below all five lines
One thing I noticed from the screenshot is that the current price is below all five displayed moving-average lines.
Indicator Chart value
VMA 1 US$18.21
VMA 2 US$18.29
VMA 3 US$18.48
VMA 4 US$18.26
VMA 5 US$18.12
Current price US$17.89
This tells me that the short-term technical picture is weak.
The moving-average lines are potential resistance areas that I will monitor.
I would like to see QYLD recover above US$18.12 first, followed by US$18.21–US$18.29.
A stronger recovery above US$18.48 would improve the technical picture.
I am not buying because the chart has already turned bullish. I am buying a small position while monitoring whether the correction stabilises.
3. Support around US$17.50 and US$17.21
Looking at the historical candles, I can identify two areas worth watching.
* US$17.50: An initial area to monitor for support.
* US$17.21: The previous visible swing low on the chart.
If QYLD stabilises around US$17.50, I will watch for buyers returning.
If it falls towards US$17.21, I will reassess whether the decline is becoming more serious.
A decisive breakdown below US$17.21 would weaken my buying thesis.
4. Volume analysis
The screenshot shows approximately 9.46 million shares traded.
The latest red candle indicates selling pressure, and the relatively elevated volume tells me that the decline deserves attention.
I want to see whether selling volume decreases in subsequent sessions.
If the price stabilises while volume improves on green candles, that could suggest buyers are returning.
I would also like to monitor RSI and MACD before increasing my position. Neither indicator is displayed in my screenshot, so I won’t assume that QYLD is already oversold.
2️⃣ What’s my plan from here?
🐱 Continue accumulating gradually
My intention is not to invest everything in QYLD immediately.
I will continue monitoring its price and monthly distributions.
If the price stabilises and the fund’s underlying strategy remains attractive, I may consider adding gradually.
If QYLD continues falling, I will not automatically average down without reassessing the market.
📉 Keep QQQ on my shopping list
My bigger objective remains accumulating QQQ.
I want to own the Nasdaq 100 for long-term growth, but I would prefer to increase my exposure during a meaningful correction.
I will watch the earnings of NVIDIA, Microsoft, Amazon, Alphabet and other major holdings.
If their fundamentals remain healthy while valuations become more attractive, I may redirect additional capital towards QQQ.
🐱 My final thoughts
I bought QYLD yesterday at US$17.87 because I prefer its income-oriented covered-call strategy while waiting for a better entry into QQQ.
Technically, QYLD has pulled back from US$18.76 and is trading below all five displayed moving averages. This means I am entering during weakness, not after a confirmed bullish reversal.
My approach is to accumulate carefully, monitor the US$17.50 and US$17.21 support areas, and watch whether the price can recover above its moving averages.
My investment philosophy is simple:
🐱 QYLD for an income-oriented Nasdaq strategy.
🐱 QQQ for long-term capital appreciation.
🐱 Cash for bigger market corrections.
I don’t need to chase the Nasdaq at elevated prices. I would rather build my position patiently and wait for the right opportunity.
Disclaimer: This is my personal investment strategy, not financial advice. QYLD can lose capital, distributions are variable, and covered calls limit upside potential.
Sources for further reading:
* Global X – Official QYLD fund information
* QYLD 2026 SEC summary prospectus
* QYLD holdings and portfolio breakdown@AI_FocusedTrader @TigerStars @Shernice軒嬣 2000 @InverseCramer 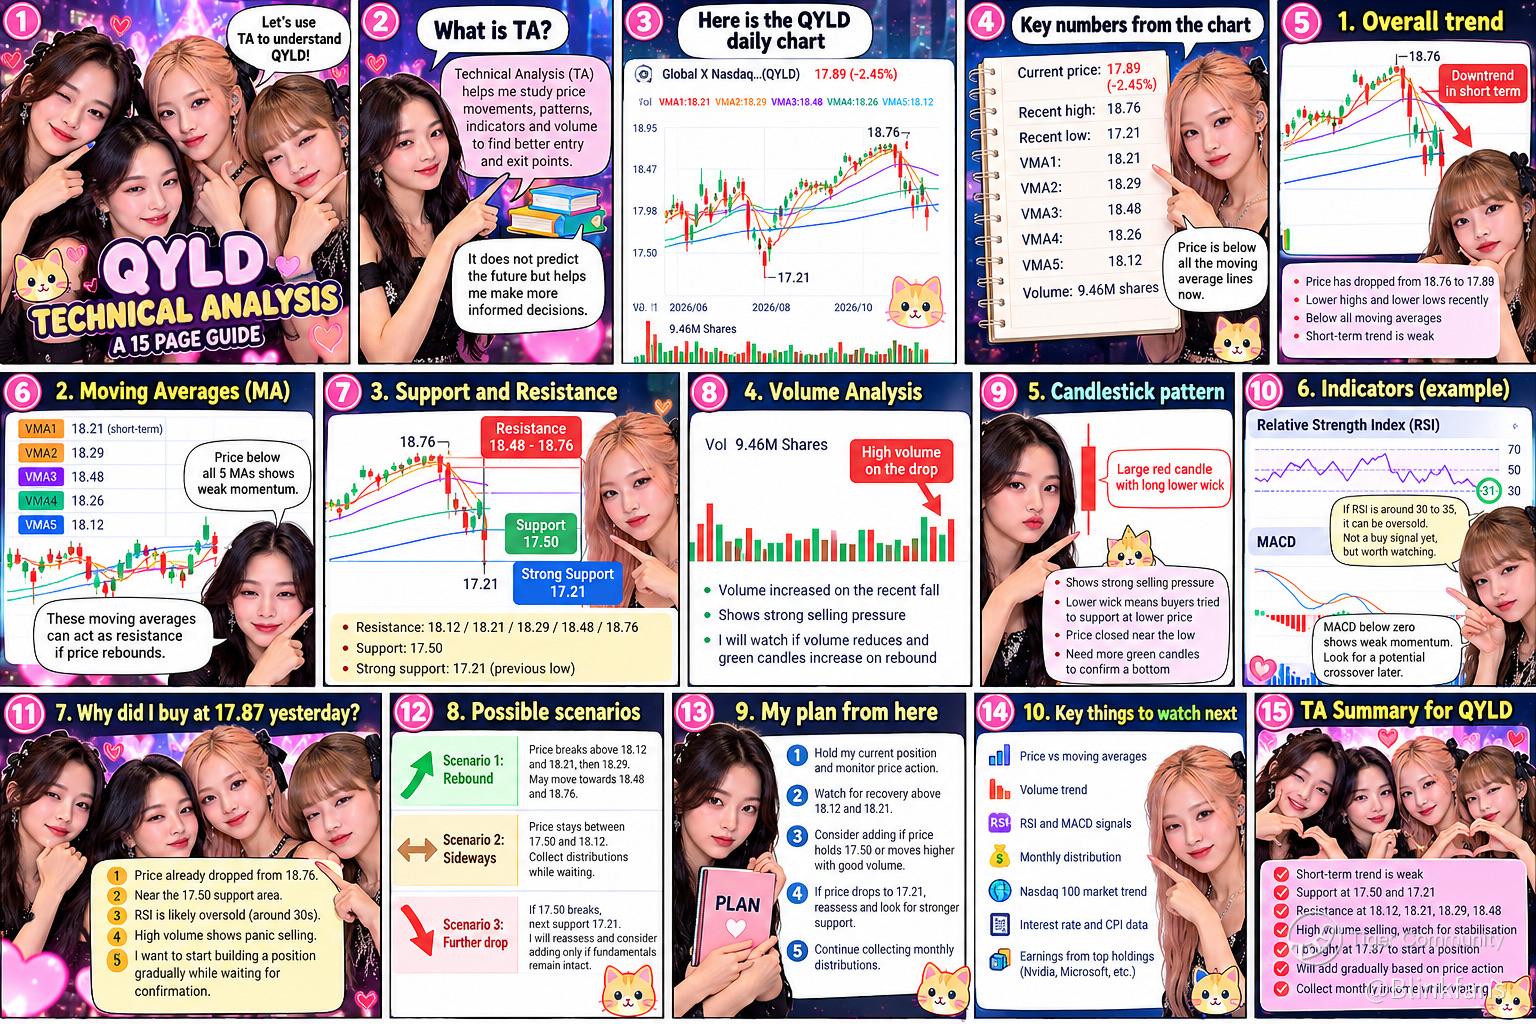
Disclaimer: Investing carries risk. This is not financial advice. The above content should not be regarded as an offer, recommendation, or solicitation on acquiring or disposing of any financial products, any associated discussions, comments, or posts by author or other users should not be considered as such either. It is solely for general information purpose only, which does not consider your own investment objectives, financial situations or needs. TTM assumes no responsibility or warranty for the accuracy and completeness of the information, investors should do their own research and may seek professional advice before investing.


