Let’s begin by acknowledging the tough sledding for traders and investors alike, over the last six months. We hear frequent feedback from thousands of our members who are either managing their own portfolios or those of their families. As well, many of our members are professional money managers themselves. While it's beneficial to know where we have been, life is lived in forward motion. We can use the context of where we have been to project what is most probable next.
One stock that has our attention at this time is Nvidia (NASDAQ:NVDA). This is part of our “Nifty Fifty” list published on May 26, 2022. Our two head analysts, Zac Mannes and Garrett Patten, have identified 50 stocks that strongly support another leg higher in the overall market. Most of these stocks have wave counts that are closely aligned with the broader market and most have shown good relative strength during the correction. As with previous lists, candidates were vetted on basic fundamental metrics and most wave counts also fit into larger trends.
Nvidia is one of the hundreds of stocks that we track and update on a regular basis. Toward the end of last year our analysis suggested that a peak in price was near and that it would see a pullback into the Spring of 2022. The fundamental picture at that time also supported the technical structure of price formed on the chart.
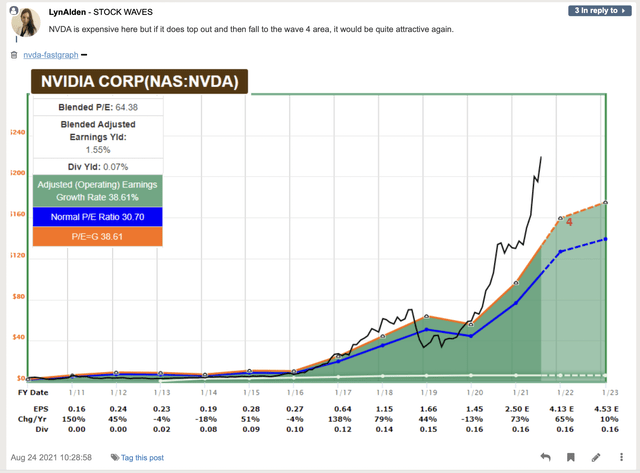
FAST Graphs
Lyn Alden produced this FAST graph on August 24, 2021, for our StockWaves members and posted that we would likely see a third wave higher followed by a fourth wave correction. Third waves tend to be the strongest impulses in price. You can see this manifested as price strongly stretched away from any reasonable fundamental valuation when it struck its peak in late 2021. Fourth waves take many twists and turns and ultimately can wear out the most patient of market observers.
This is indeed what we have seen happen over the first half of 2022. How many do you know that have either thrown in the towel or are perhaps still clutching onto that towel and wiping away the sweat on their brow formed by fear and angst?
Markets are driven by sentiment. Yes, fundamentals are important and that is why we use them in our analysis. StockWaves is where fundamentals and technicals align. A salient point to keep in mind is that sentiment works on a continuum. This means that the larger the market capitalization of an individual stock analyzed, the greater effect sentiment will exert. A smaller stock, such as a biotech start-up, will be influenced more by its fundamentals and perhaps expectations of results and/or clinical trials.
The entire market itself, E.G. the S&P 500, is perhaps one of the greatest and clearest manifestations of sentiment at any given time. Sentiment is simply fear vs. greed. Again, fundamentals come in to play, but it's our experience that fundamentals rarely, if ever, lead price. To illustrate, how many times have you personally observed price action in a stock or the market that simply makes no sense? There's no logical explanation to be found. Or, is there?
We have observed that one cannot successfully apply logic to an emotional environment. Have you ever attempted to reason logically with a close friend, significant other or family member who is in a heated emotional state? How did that work out? Attempting to overlay logic where emotion dominates is an exercise in frustration and is ultimately folly.
There is however a method tried and true over decades of use that can measure, track, and then project forward what is the most probable path of price in the market or an individual stock. If you have followed our writings you know that this method is Elliott Wave. We then apply Fibonacci Pinball to that analysis.
Just a few weeks ago, on May 15, 2022, Lyn Alden posted this FAST graph showing that Nvidia was reaching a much more reasonable valuation from a fundamental perspective.

FAST Graphs
This analysis dovetailed perfectly with our technical viewpoint. Price was completing a corrective pattern down and we were watching for an imminent reversal. Note the structure of price shown on this chart below.
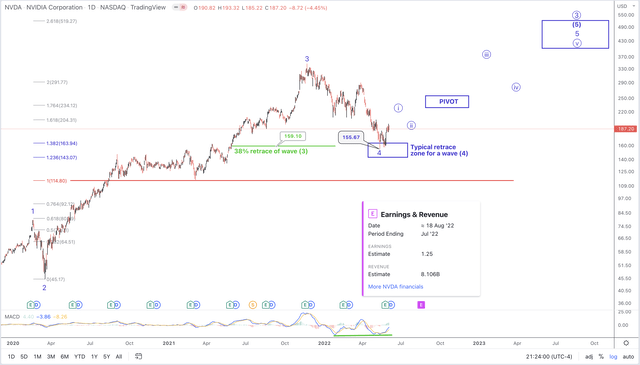
NVDA Daily (TradingView)
We had been watching the zone highlighted at $143 - $164 with a focus on the $159 level. The $159 level represents a 38% retracement in price of the prior wave 3 shown on the chart. As well, in Fibonacci Pinball, a fourth wave will typically pull back from the 2.00 extension of waves 1-2 and strike the 1.236 to 1.382 extensions (shown in blue).
This current setup is ideal to begin the next wave up. It’s time for Nvidia to heat up once again. Keep in mind that Elliott Wave is fractal in nature. That means that there will be self similarity in all waves at all degrees. Put another way, the larger 5 wave structure that you can see illustrated on the daily chart will also be composed of smaller structures that will form 5 waves of their own.
So, in a standard impulsive structure up from the low marked as wave 4 that was struck at $155.67, Nvidia should form 5 waves up in what would be the wave circle ‘i’ you see. At this time, price has only formed 3 waves up. We are still cautious and awaiting confirmation of this initial 5 waves up from the recent low.
This initial 5 wave structure up, once formed, would strongly suggest the bearish corrective phase is indeed complete and that a trend change has taken hold. The anticipated pullback in wave circle ‘ii’ would be a buying opportunity. Typically, price will retrace 38% to 62% of wave ‘i’ in that wave ‘ii’.
We will then be able to project likely targets and path overhead. We will use what you see on the chart marked as the PIVOT. This will represent the next lesser degree and will be wave [i] and should see a smaller wave [ii] pullback. Once above the pivot, we will move support levels up and fine tune our projections even further.
Now, before you think we all sit around with tinfoil hats on our heads and pointing our molars to the moon seeking guidance from a higher power, please realize that this methodology has been observed for nearly 90 years now and has kept us on the right side of the market much more often than not. Many will not accept that it does indeed produce positive results. We will continue to offer our work to those that are willing to explore new horizons.
Another point to keep in mind is what is shown on the daily chart. Should price break below $114 instead of unfolding as we have shown, then our primary assessment would need adjustment. However, it's likely that if that was the path going forward, the initial 5 waves up we are anticipating would not complete and this bounce would stop with only 3 waves up. Also, price would probably form a micro 5 wave structure to the downside. But until that happens, we will continue to follow our primary scenario shown here.
Some make look askance at Elliott Wave. Frankly, I don't blame them. Not all self-proclaimed Elliott Wave experts are truly such. This is not to disparage others. However, there are specific guidelines that the analyst should follow so as to obtain the desired result. We are looking to find high probability setups, these being short, medium or long term in nature. It is our desire to provide high-quality, actionable analysis that keeps us on the right side of the market. We believe that our track record speaks to this.
We will provide our primary scenario as well as at least one alternative possibility. This is not an attempt to put forth so many scenarios that one of them must come true and we proclaim victory, vigorously patting ourselves on the back. Please recognize that markets and the stocks of which they are comprised are non-linear, fluid and dynamic in nature. We adapt in real time to what we're given. As well, analysis will evolve and become even more clear as data fills in the chart. There will come a moment where the analyst can apparently even complete the sentence for the stock or market they observe.
One way of comparing our analysis is to that of a head coach of a football team and the staff that compose a game plan for their upcoming opponent. Many coaches even have 15 pre-scripted plays that they run at the beginning to see what the reaction of the opposing coach will be. As well, the game plan of each coach usually has provisos and possible adaptations given certain scenarios that can come up during the actual game.
The football coach must adapt to what's given during the real game. It simply is not possible to stubbornly stick to one specific path when the facts in front of you change. We do the same in our analysis. There's a likely path in the bigger picture. This is similar to it being likely that the superior team will come out victorious in any competition. We have our most likely scenario that we follow, but we also have an alternative to consider.
Being able to quickly adapt to changing landscapes is one of the hallmarks of Elliott Wave analysis, when correctly applied.
I would like to take this opportunity to remind you that we provide our perspective by ranking probabilistic market movements based upon the structure of the market price action. And if we maintain a certain primary perspective as to how the market will move next, and the market breaks that pattern, it clearly tells us that we were wrong in our initial assessment. But here's the most important part of the analysis: We also provide you with an alternative perspective at the same time we provide you with our primary expectation, and let you know when to adopt that alternative perspective before it happens.
There are many ways to analyze and track stocks and the market they form. Some are more consistent than others. For us, this method has proved the most reliable and keeps us on the right side of the trade much more often than not. Nothing is perfect in this world, but for those looking to open their eyes to a new universe of trading and investing, why not consider studying this further? It may just be one of the most illuminating projects you undertake.