Is A US Stock Market Correction Coming?
In the first week of the year, the U.S. stock index rebounded in a relatively calm environment. As weekly-level lows appear, important swing lows also appear simultaneously. Throughout January, if the stock price goes down again and breaks through the support, we need to be alert to large-scale correction that will follow.
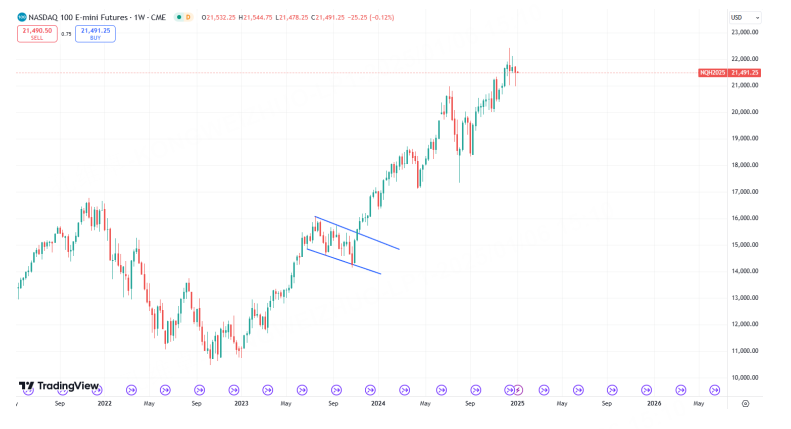
Due to the poor performance of heavyweights in the Nasdaq Index, there was actually a slight puncture in the previous weekly market. However, considering the overall synchronization of the index, we still believe that the support area formed by 21000/20983 has not fallen. The last time the Nasdaq broke weekly level was in 24 years, when it fell from 20,000 to around 17,000 at most.
In addition, it should be noted that from the monthly chart, the index has left an obvious upper shadow line, while the positive line entity is very small. If the similar situation in the historical trend is not "aerial refueling" (it needs to reach a new high soon), it is basically the adjustment cycle and intensity of more than 2-3 months.
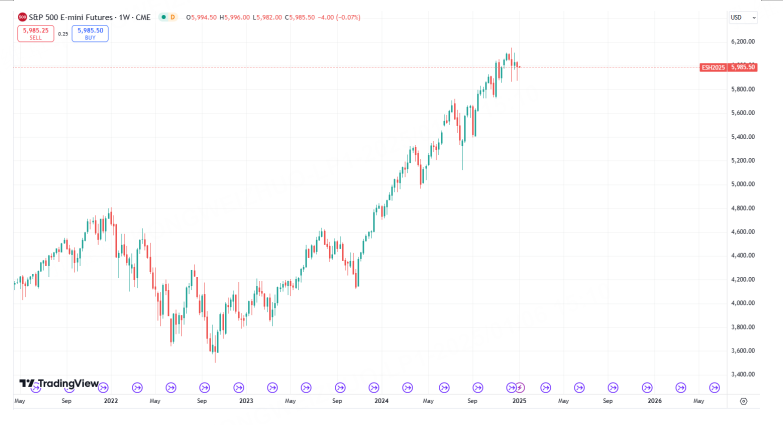
On the S&P, the low point of 5866 was preserved, and the second low point appeared at 5874, which can basically be considered as the core support level. Referring to the Nasdaq at the same time, you can roughly judge the possible risk of market changes.
In fact, the time factor is also critical for US stocks now. It's only been a few days since Trump officially moved into the White House again. How to treat the market after he takes office is expected to get a direct answer from price changes.
According to our expectations before the general election: the Democratic Party can get a buffer period of 1-2 quarters + if it wins, and Trump's words will trigger adjustments earlier. Although the U.S. stock market even reached a new high after the November election, in the face of the high index price, if Trump does not suppress it, how to continue to make the market thrive during his four-year term will become a difficult problem.
No matter which angle you look at it, it seems more reasonable to suppress and then support your own concept stocks (the leader). Of course, there is a high probability that the inducing factors in this aspect will be developed from other angles, such as anti-globalization, rather than comments directly aimed at the stock market.
For most traders, it is still possible to watch while walking, and withdraw while playing. However, if the price breaks down on the above two indexes, then don't hesitate, it's time to run.
If the position is broken in the end, do you want to chase the empty position? On this issue, I think we can follow up a little with a small position, but try to wait for the correction of the main position before intervening. For example, the S&P is at 6000 and the Nasdaq is at 21800/22000, which will have a better profit-loss ratio. (It is particularly emphasized that this is the rebound position after the position is broken, not the reference point that has not yet been broken)
$NQ100 Index Main 2503 (NQmain) $$SP500 Index Main 2503 (ESmain) $$Dow Jones Index Main 2503 (YMmain) $$Gold Main 2502 (GCmain) $$WTI Crude Oil Main 2502 (CLmain) $
Disclaimer: Investing carries risk. This is not financial advice. The above content should not be regarded as an offer, recommendation, or solicitation on acquiring or disposing of any financial products, any associated discussions, comments, or posts by author or other users should not be considered as such either. It is solely for general information purpose only, which does not consider your own investment objectives, financial situations or needs. TTM assumes no responsibility or warranty for the accuracy and completeness of the information, investors should do their own research and may seek professional advice before investing.


