Techs Review: September To Be volatile, Focus On Techs Opportunities
September kicked off with the Labor Day holiday, and even though the market was closed for just one day, market sentiment seemed to shift subtly. While the TMT sector's overall performance last week wasn't exactly lackluster, risk-averse sentiment still rose.
The divergence across TMT sub-sectors has a clear frontrunner: Quantum technology surged with a strong bullish candle, posting a weekly gain of 3.9% (0.4σ) and soaring 33.9% year-to-date, solidifying its position as the sector's main driver. Following closely are Security Software and Hardware, with weekly gains of 3.2% (0.8σ) and 2.5% (0.6σ), respectively. Their year-to-date returns also remain in double digits at 11.6% and 19.4%, supported by solid fundamentals.
The lagging sectors—semiconductors (Semis) $Philadelphia Semiconductor Index(SOX)$ and semiconductor equipment (Semi Equip)—faced pressure this week, declining 1.5% (-0.3σ) and 1.2% (-0.2σ) respectively. Fortunately, they still hold year-to-date gains of 13.8% and 2.0%, respectively, avoiding a complete breakdown. Media also saw a minor pullback of 0.5% (-0.2σ), preserving its 11.4% year-to-date return for now.
Individual stocks are experiencing a stark contrast between extreme highs and lows.
The top gainers include: $MongoDB Inc.(MDB)$ (+44.1%), $Aehr Test Systems(AEHR)$ (+37.8%), $Chegg Inc(CHGG)$ (+22.5%) directly set the stage for a doubling rally, drawing maximum capital attention; Major decliners included: $Etsy, Inc.(ETSY)$ (-15.4%), $Marvell Technology Group Ltd (MRVL) (-13.9%), and $Opendoor Technologies Inc (OPEN) (-11.2%), each experiencing corrections exceeding 10%.
In terms of themes, Bitcoin-related assets delivered the strongest performance this week, rising 5.3% over the week and posting a positive 3.4% gain year-to-date. Non-profit tech followed closely, climbing 4.0% over the week (0.7σ).
September Focus on Macro Trends: Nonfarm Payrolls May Trigger Volatility, Tech Stocks' Seasonal Dip, and Post-Rate-Cut Market Movements
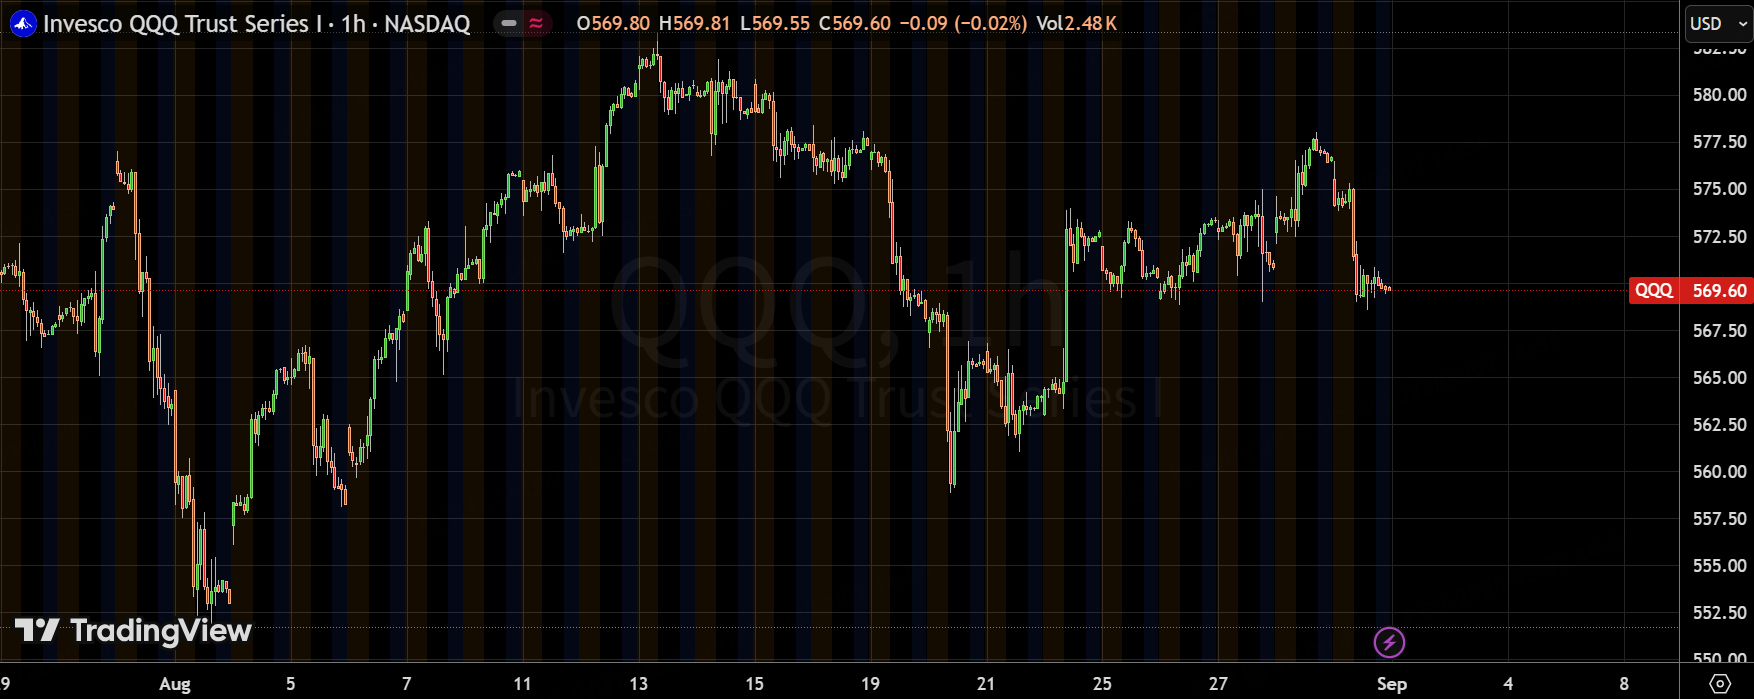
Our outlook for the next month-plus is: "An upward trend amid volatility, culminating in a breakout." August has already validated this pattern: $Nasdaq 100 ETF (QQQ)$ Despite persistent fluctuations throughout the month, it ultimately closed up 1%. September is highly likely to replicate this trajectory.
However, there are two key points:
1. Fed Rate Cut Window: High Win Rate for U.S. Stocks After First Rate Cut
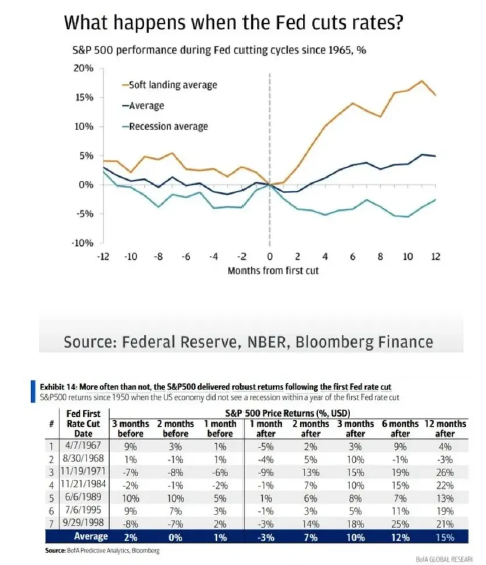
September 17 may see the "first rate cut," marking a pivotal event. Historical data since 1965 shows the S&P 500 performs differently across three scenarios during rate-cut cycles: gains surge most in soft-landing scenarios, average performance maintains steady returns, and only recession scenarios exert downward pressure. Focusing specifically on cases where no recession occurred within one year after the first rate cut (data since 1950), U.S. stocks show even stronger performance: - Average gain of 1% in the month preceding the cut - 7% gain in the month following the cut - 10% gain after 3 months - 15% gain after 6 months - 12% gain after 12 months This data holds significant reference value for positioning—as long as a recession doesn't occur, there's no need to panic about the medium-term market after rate cuts.
The "September Curse" for Tech Stocks: Average 2.5% Drop Over the Past Decade
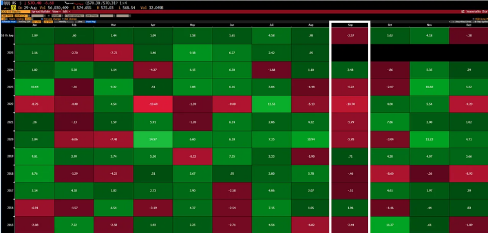
Short-term caution needed for "seasonal pitfalls": Tech stocks are about to enter September, historically their weakest month of the year. Over the past decade, tech stocks have averaged a 2.5% decline in September—over 200 basis points worse than the second-worst month. This is no minor fluctuation. More notably, the S&P 500 hit a 12-month high on August 27-28 this year. Looking back at 12 similar instances since 1950: Only September 2018 saw positive returns (0.43%), while the other 11 instances averaged a 2.13% decline. Therefore, avoid chasing highs in September. Stick to the trading logic for volatile markets: add positions during pullbacks and reduce positions at rallies (at reasonable levels). Don't chase surging sectors—it's easy to get stuck holding losing positions.
The good news is that the year-end rally holds promise: After hitting a 12-month high in late August, the market demonstrated remarkable stability between November 22 and December 27—rising in 11 out of 12 sessions with an average gain of 2.83%. This year-end rally warrants early positioning.
Tariff Case May Take a Turn? Supreme Court Final Showdown Looms
Another major development to dissect this weekend: The U.S. Court of Appeals overturned a lower court ruling by a 7-4 vote, declaring President Trump's IEEPA tariffs invalid. This case will likely proceed to the Supreme Court (with an appeal required by mid-October).
Positive Scenario: If the Supreme Court ultimately upholds the ruling and Trump's IEEPA tariffs are fully repealed, it would deliver tangible benefits to the market—boosting corporate profit margins, improving earnings expectations, and even assisting the Federal Reserve in lowering inflation (as reduced tariffs ease commodity price pressures), potentially expanding room for interest rate cuts.
Bearish Scenario: The White House will not abandon its hardline trade agenda. It is already shifting the legal basis for tariffs from the IEEPA to Section 232 of the Trade Expansion Act of 1962 (under the guise of "national security"). Should IEEPA tariffs be eliminated, Section 232 tariffs will only expand in scope, with additional Section 232 investigations launched—leaving U.S. businesses, just as they gain some tariff certainty, facing over six months of "trade uncertainty." This amounts to "robbing Peter to pay Paul."
So the conclusion is clear: Don't set your expectations too high—this won't be a catalyst for a major market move anytime soon.
Core Technology Stocks
$Amazon (AMZN)$ (Ranked as top pick for the next 6-9 months by multiple investment firms): AWS acceleration imminent, 25% growth expected by 2026, unlocking valuation potential
Why is AMZN the top pick among internet blue-chips? The core logic is simple: AWS is poised for an "acceleration moment," likely to materialize by 2026. Now is the prime window for positioning.
Microsoft released a major research report this week highlighting a key shift: From 2022 to 2024, Microsoft Azure's capital expenditures significantly exceeded AWS's. However, from Q2 2023 to Q2 2024, AWS narrowed the quarterly spending gap by $5-6 billion (Microsoft widened its lead through OAI partnerships and surging demand). AWS has now entered "catch-up mode," planning to add 8.5 to 10 million square feet of new data center space between 2025 and 2026—laying the foundation for accelerated capacity expansion.
Looking at historical data validation: In previous years, each additional square foot of AWS data center space generated $3.56 billion in incremental revenue (peaking at $10.33 billion in 2021 and bottoming at $1.45 billion in 2023); Performance since 2025 has been relatively weak ($1.65 billion per square foot, with incremental revenue of $8.8 billion in the first half of the year). Morgan Stanley attributes this to supply chain bottlenecks (GPUs, custom ASICs, cables/motherboards), which are now easing—paving the way for accelerated revenue growth from late 2025 through 2026.
More crucially, multiple institutions corroborate this: SemiAnalysis recently stated that with Anthropic's data centers coming online, AWS growth could approach the mid-20% range by mid-2026. Data from M-sci and Yipit corroborates this—AWS capacity showed slight easing in July-August. Yipit projects Q3 growth at 19%. Should this materialize, investors would likely extrapolate Q4 growth to 20%, marking the onset of an "acceleration signal."
Why is AWS acceleration so crucial? It's not just about boosting gross margins or fueling retail business profitability—the core driver is lifting valuation. While NFLX and META's valuations have rebounded to elevated levels, AMZN's valuation remains mid-range for the 2023-2025 period (2023 marks the starting point where AWS growth dipped to 10%+). Should AWS regain 20%+ growth, AMZN's valuation would likely return to 15-20x EBITDA.
Let's do the math: Assuming AWS growth approaches 25% in mid-2026, and assuming the retail business maintains its current profit margin logic, applying a 15-20x valuation to 2027's projected $250 billion EBITDA (vs. the market consensus of $232 billion) yields a target price of $350-$470. This represents a 50-100% upside potential from current levels—a remarkably attractive opportunity for a large-cap stock.
$Reddit(RDDT)$ Add positions when the 20-day moving average is reached; LLM's role as the "data foundation" remains irreplaceable
This week, when the RDDT pulled back to the 20-day moving average, we rebuilt the positions we had previously reduced at higher levels. The core rationale is threefold:
User growth remains steady: Quarterly tracking indicates that RDDT's user growth has not slowed, reflecting solid fundamentals.
The "Essential Need" of the LLM Era: In June this year, Semrush conducted a study cited over 150,000 times—revealing that reddit.com ranks first as the primary source of facts for LLMs like ChatGPT and Perplexity, accounting for 40.1% of references. This significantly outpaces Wikipedia (26.3%) in second place. This underscores Reddit's increasingly solid position as the "data foundation" within the AI industry chain, a narrative that continues to gain traction.
A pullback presents an opportunity: The 20-day moving average serves as strong short-term support. This pullback offers a perfect window to add positions—no need to wait for a deeper decline.
$Google A (GOOGL)$ $Google (GOOG)$ : Reduce position to small allocation due to insufficient value proposition + pending event risk resolution
This week we reduced our GOOGL holdings further, now maintaining only a very small long position—not because we're bearish, but to "manage risk according to process":
Low valuation-to-performance ratio: Our FY26 EPS estimate stands at $10.75. At a 20-22x valuation multiple, last Friday's price implies a maximum upside of less than 10%, significantly lower than the potential for AMZN and RDDT.
Data shows signs of slowing: While 3P figures remain acceptable (M-sci meets expectations, Yipit exceeds by 2-3 percentage points), growth momentum has been weakening in recent weeks compared to previous periods.
Event risk remains unresolved: Meta may announce key decisions at any time. Until this uncertainty is resolved, maintaining a small position is the more prudent approach.
Of course, if the market increasingly views GOOGL as an "AI winner," its valuation could surpass 22x. But note: 22x already represents a high point over the past decade (excluding the pandemic period), so caution is advised when chasing highs.
Disclaimer: Investing carries risk. This is not financial advice. The above content should not be regarded as an offer, recommendation, or solicitation on acquiring or disposing of any financial products, any associated discussions, comments, or posts by author or other users should not be considered as such either. It is solely for general information purpose only, which does not consider your own investment objectives, financial situations or needs. TTM assumes no responsibility or warranty for the accuracy and completeness of the information, investors should do their own research and may seek professional advice before investing.
Absolutely loved it! Worth reading a few times through.