Too Early To Go All In:How To Trade For A Second Market Low?
Trend Insights:
It is still too early to turn fully bullish on U.S. equities; the main strategic focus should be on trading a potential second bottom rather than rushing to deploy all capital.
The current market is shifting from a one-way rally driven by expectations of monetary easing toward a choppier regime in which investors are repricing the timing of rate cuts, the AI bubble, and credit spreads.
Over the medium term, U.S. stocks still have a good chance of delivering a “Santa rally,” but near-term risks have not been cleared, and the necessary conditions for a durable reversal are only gradually falling into place, so the time for an all-out long stance has not yet arrived.
December rate cut not locked in
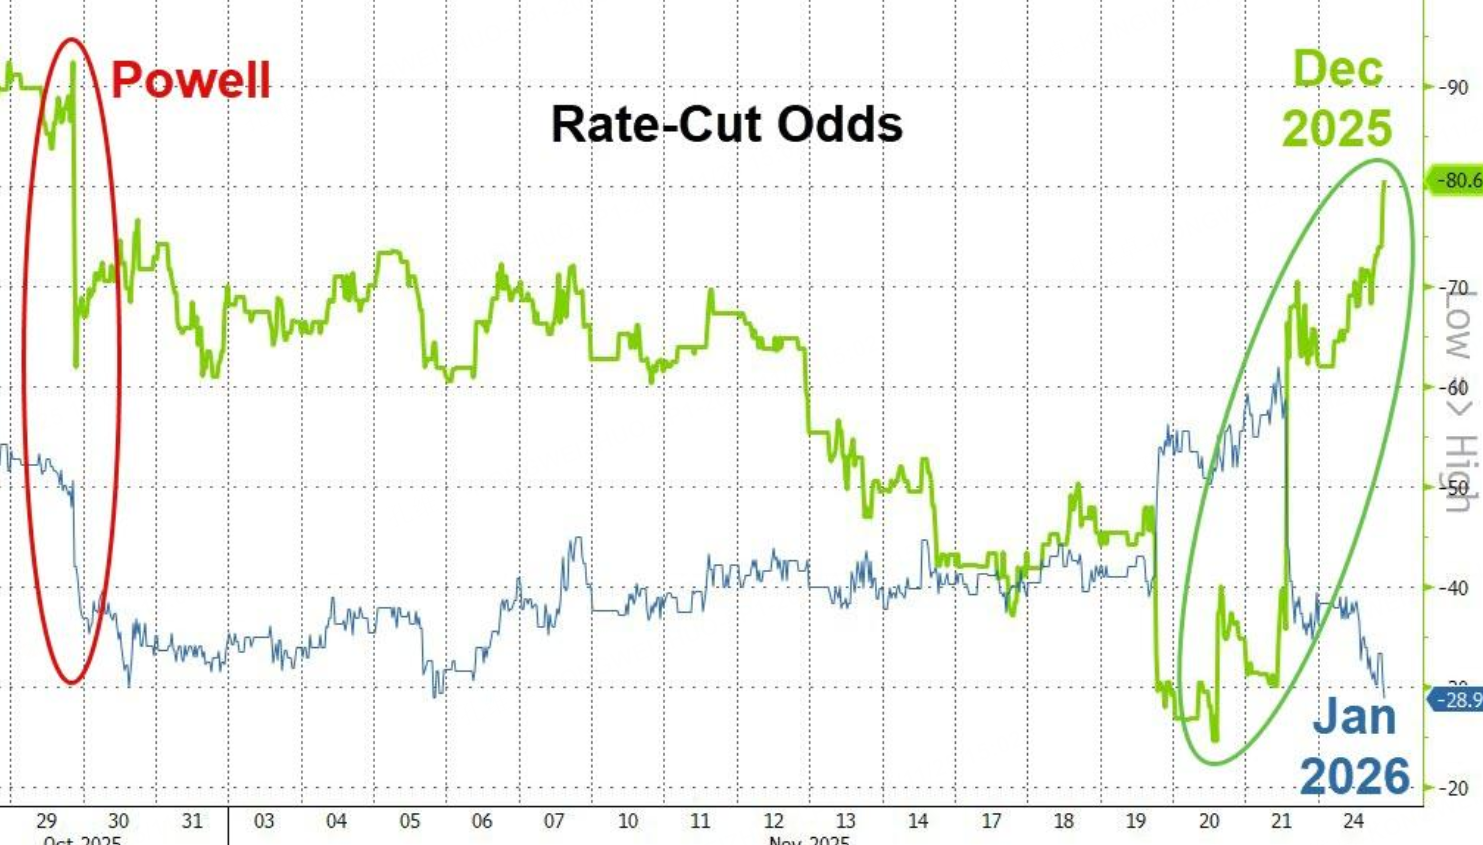
At the moment, the probability of a December rate cut implied by Fed funds futures has quickly surged to above 80%, well above roughly 40% at the end of last week and about 70% on Monday.
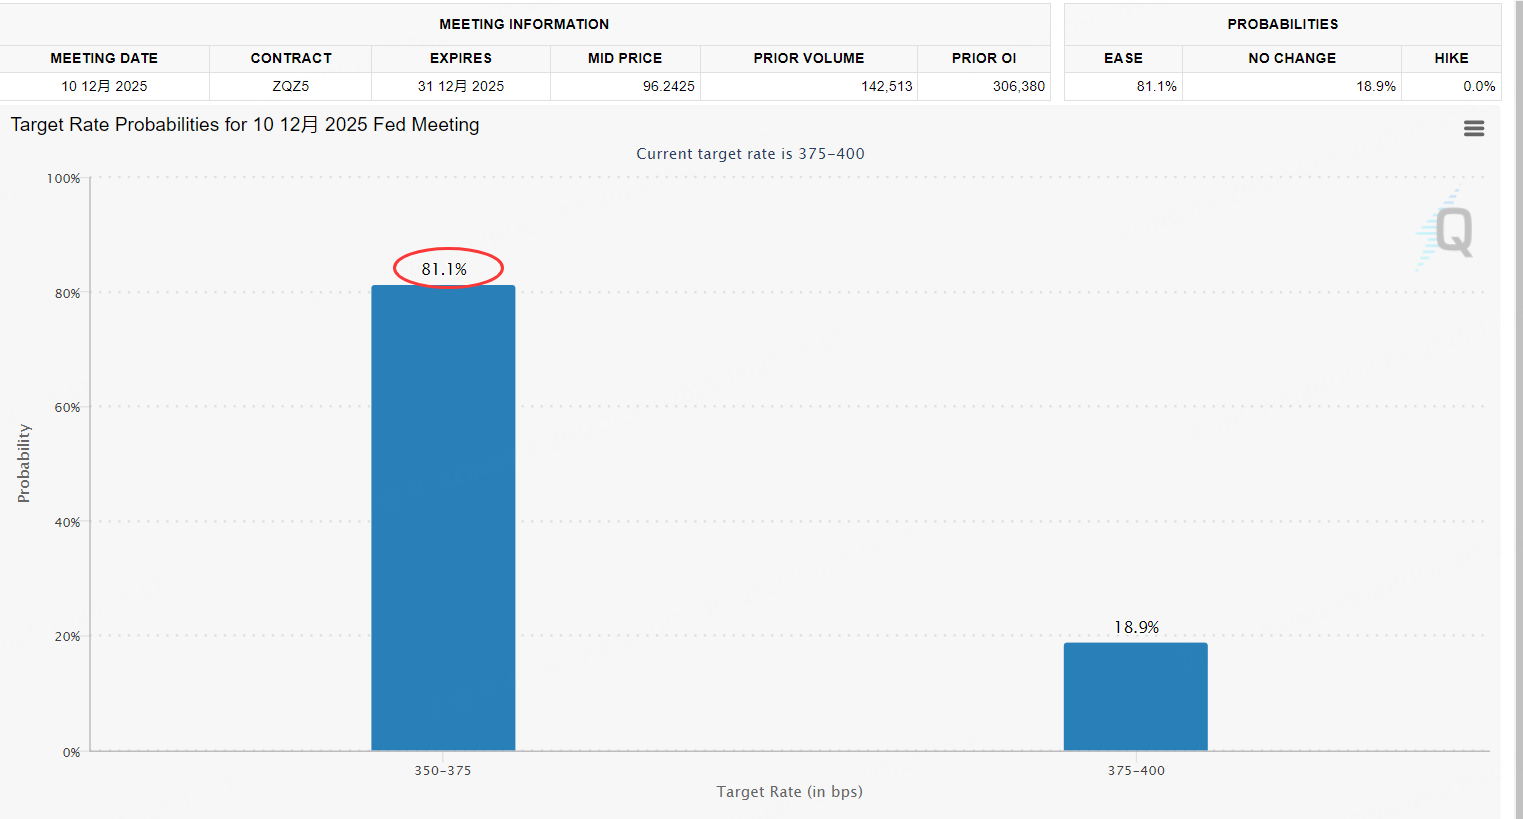
However, because this repricing has occurred without support from any major macro data, the expectations themselves are inherently unstable and not enough to justify an immediate V-shaped rebound in U.S. equities.
Under these conditions, a more realistic assumption is that the market may first complete a technical second-bottom test to verify the durability of the lows before it can transition into a more sustainable uptrend.
From a policy perspective, there is currently a delicate internal balance at the Federal Reserve that leans only slightly dovish. Roughly five officials have clearly voiced opposition to cutting rates next month, while another five have openly signaled support for a cut.
5 voters signaled they do not want to cut rates next month (Barr, Musalem, Schmid, Goolsbee, Collins)
5 voters signaled they want to cut rates (Miran, Waller, Bowman, Williams, Cook)
2 voters’ opinions are unknown (Powell and Jefferson)
The latest dovish comments from San Francisco Fed President Daly have tilted the headcount slightly in favor of the doves, which in turn has pushed market pricing for a December cut above 80%.
Even so, the crucial positions of Chair Powell and Vice Chair Jefferson remain undecided in public communications, leaving meaningful uncertainty around the final decision.
More importantly, the investment-grade credit market—where credit risk repricing is most visible—has so far delivered only a weak rebound rather than a genuine trend reversal.
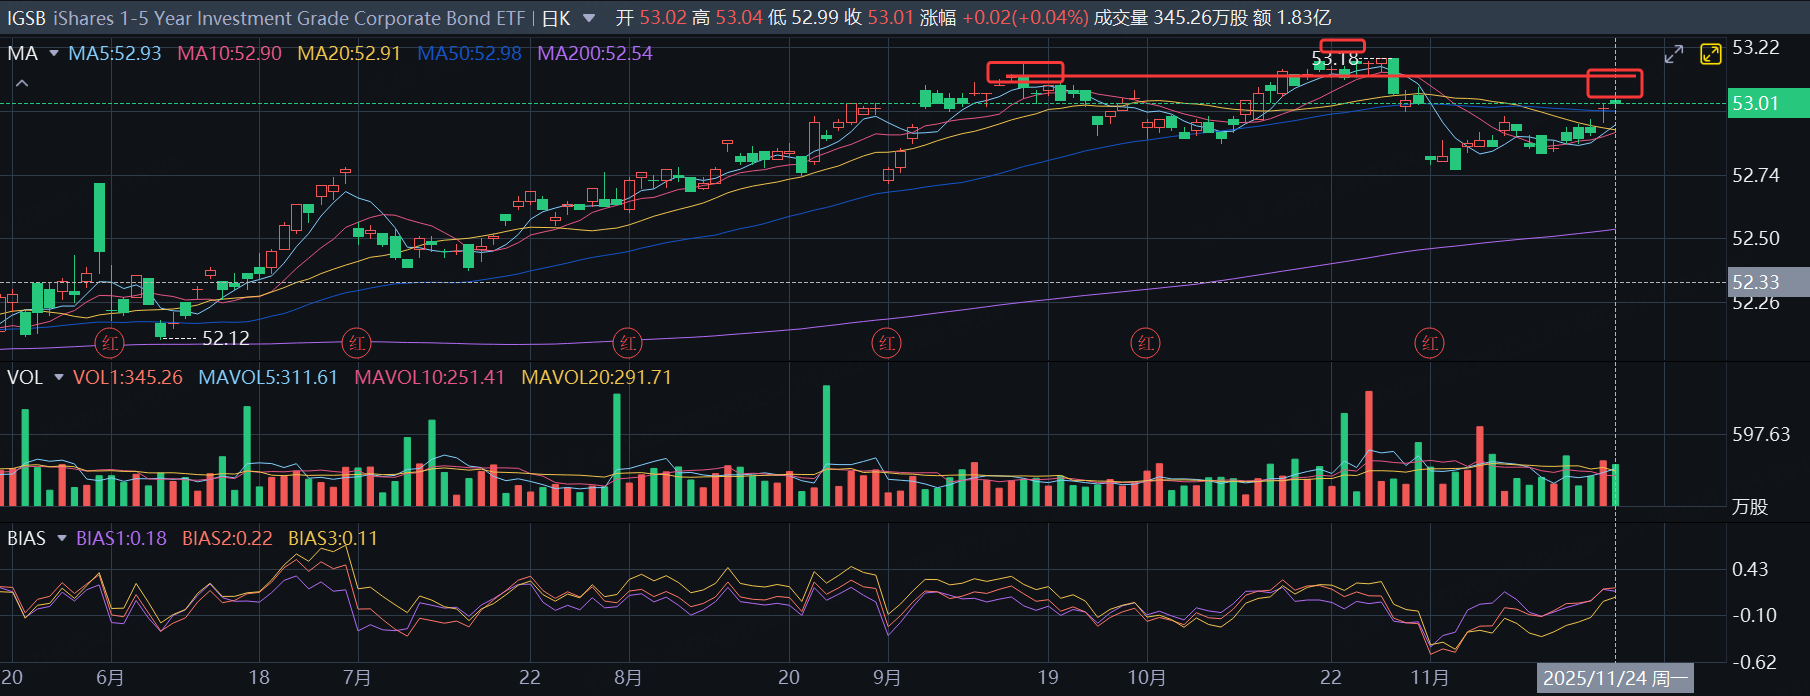
The short-duration investment-grade corporate bond ETF IGSB has seen a modest price recovery recently, but it continues to hover around its moving averages and has not yet broken through either its medium- or long-term moving averages to form a convincing “reversal structure.”
During the last major selloff in U.S. equities, rising yields and widening credit spreads directly compressed the discounted cash flow valuations of large-cap tech, so only when these investment-grade credit products decisively break above their neckline and reclaim prior highs can one say that the systemic pressure from rates is truly receding.
Risk sentiment not fully reversed
On the liquidity and sentiment front, the damage from this correction has gone well beyond a normal pullback.
Goldman Sachs data show that net outflows from tech sector stocks at prime brokerage desks have reached their most extreme levels in nearly two years,
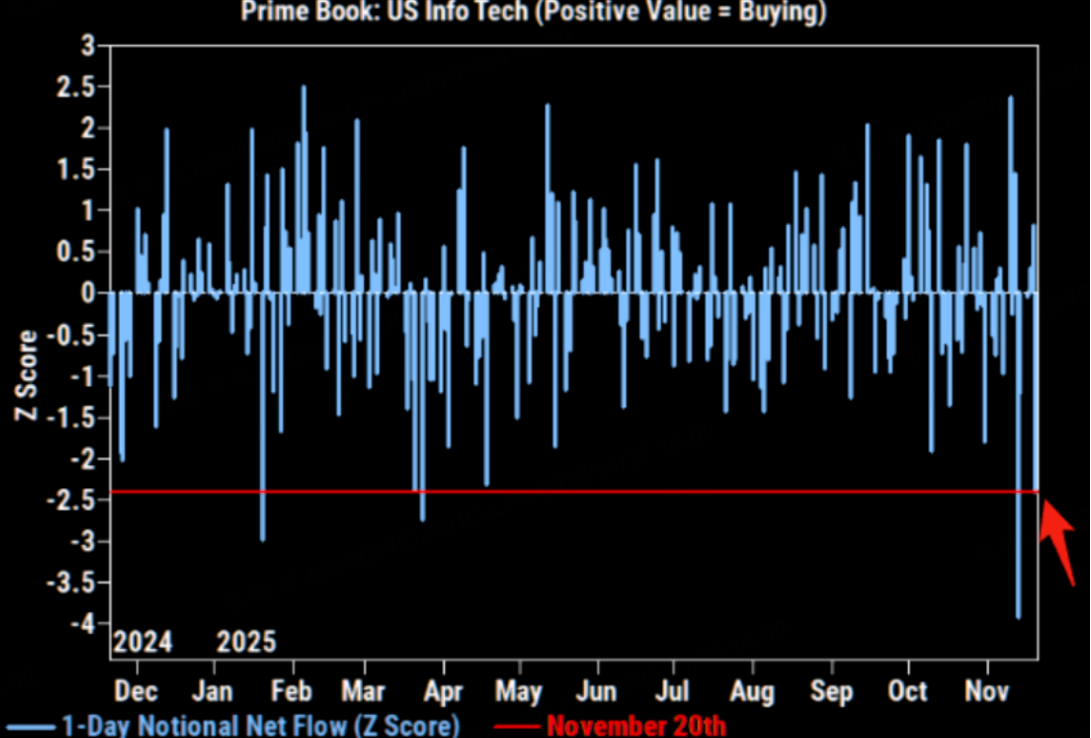
indicating that this is not just a light position tweak but rather a concentrated de-risking focused on prior AI themes and richly valued mega-cap tech stocks.
Another important bellwether is Bitcoin, which is still in a distinctly bearish technical structure. The daily chart of the main CME Bitcoin futures contract shows that prices have fallen sharply from their recent highs, with a drawdown of close to 30%, and multiple key moving averages have turned downward;
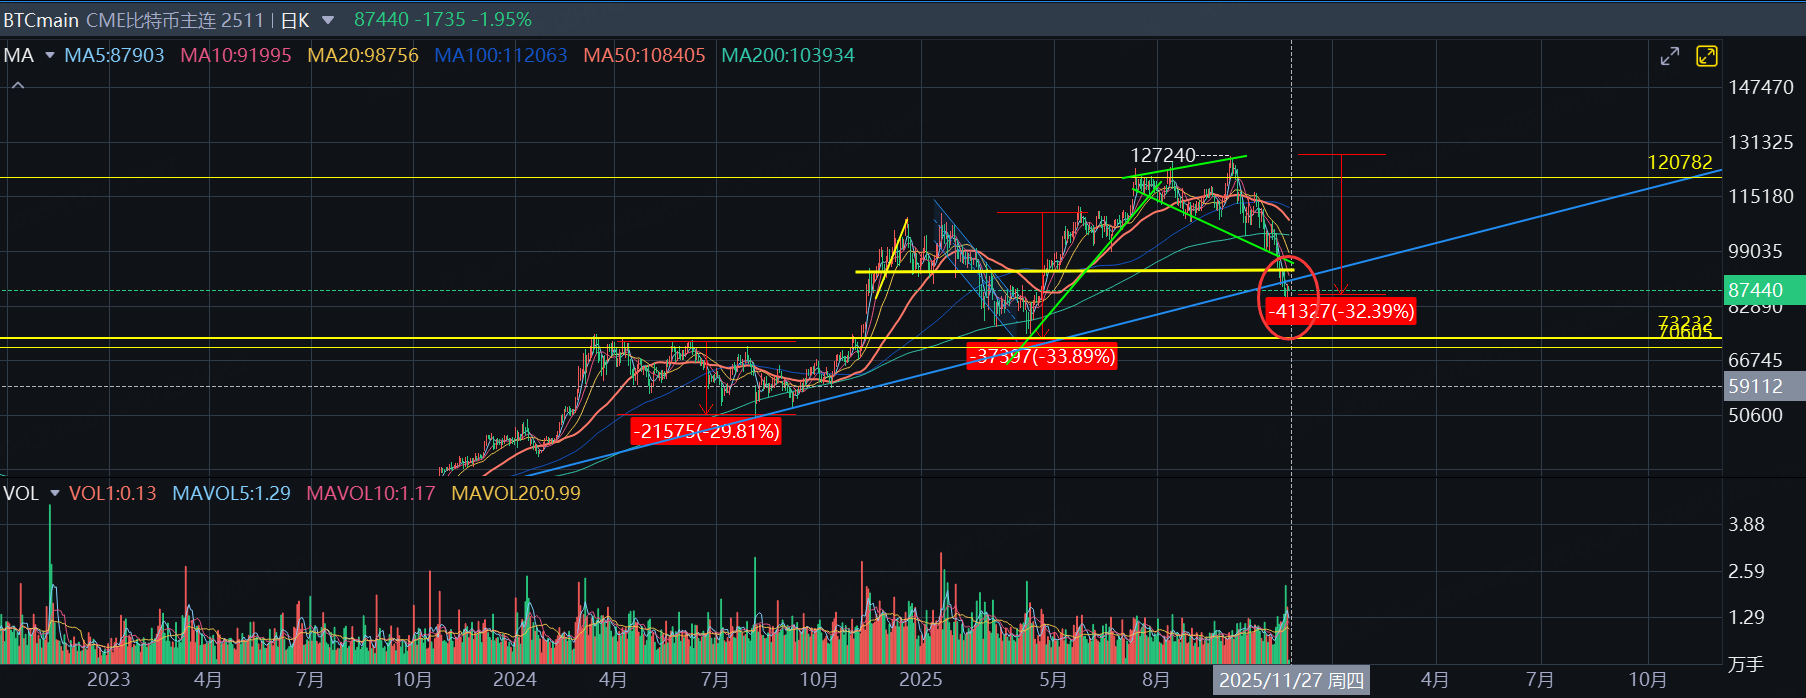
although prices have temporarily stabilized at an important support zone, there is no clear reversal pattern yet.
On the spot side, data indicate that long-term holders have sold more than 800,000 coins over the past month— the largest such wave since January 2024—while U.S. spot Bitcoin ETFs have seen rare and sizable net outflows in recent weeks, suggesting that previously steadfast bullish capital is now withdrawing in an orderly fashion.
Technical structure and second bottom
From the perspective of the major U.S. equity indices themselves, the current rebound in the S&P 500 is not yet strong enough to invalidate its bearish head-and-shoulders pattern.
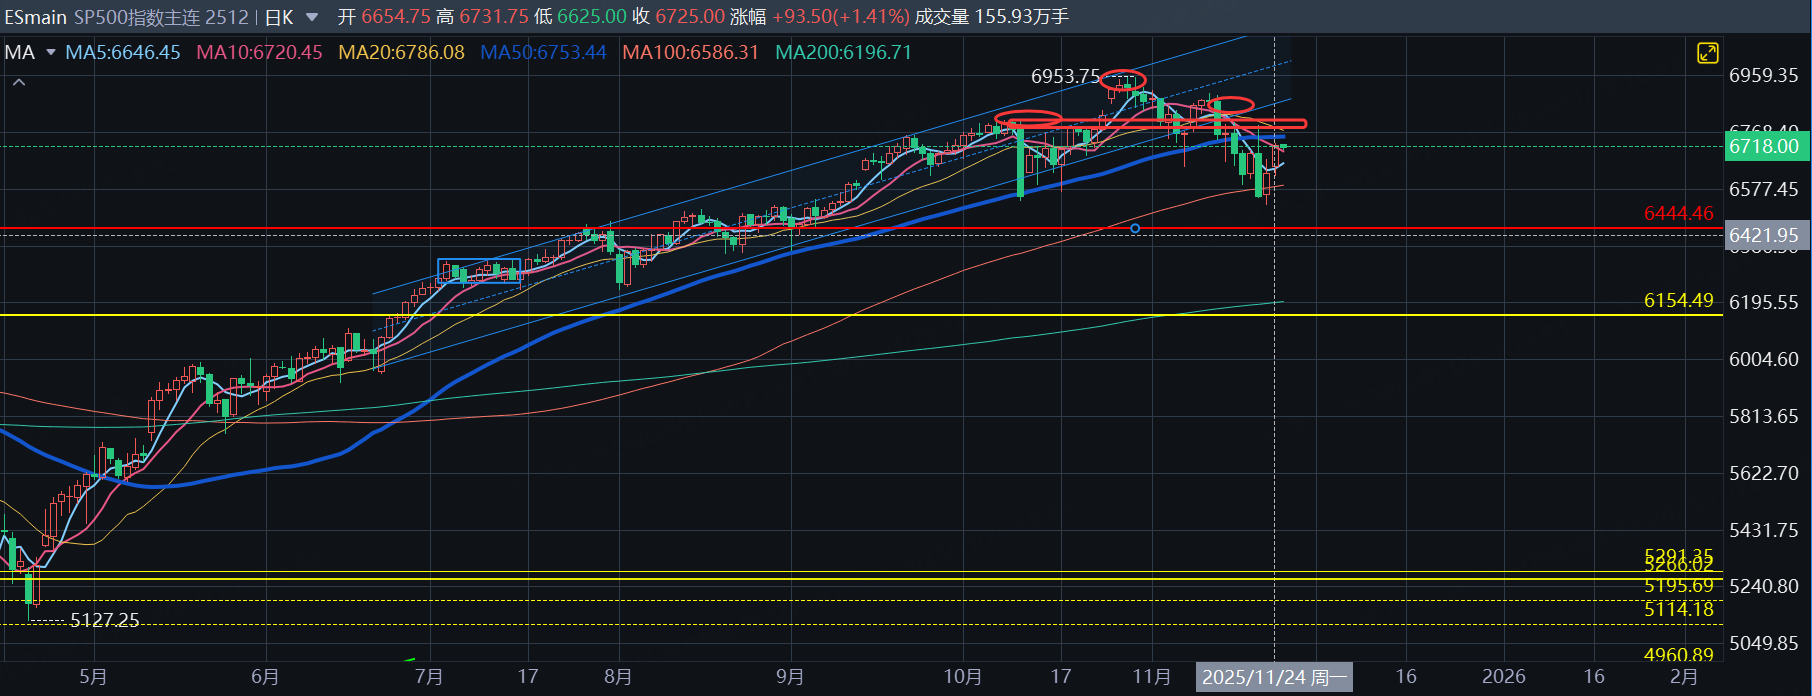
Only if the index manages to reclaim the 20-day moving average, break through the neckline resistance, and then go on to take out its previous highs can one declare that the AI-bubble and rate-cut–volatility-driven correction has run its course.
For now, price action in the main S&P 500 futures contract looks more like a post-selloff reflex rally than the start of a sustained new uptrend.
Historical experience suggests that after each major selloff low, the market almost always comes back to make a second-bottom attempt in order to test the firmness of the base.
Given that neither the fundamental backdrop nor investor sentiment has yet turned decisively positive in a “mutually reinforcing” way, assuming a clean, straight-line V-shaped reversal at this stage appears overly optimistic.
Strategy: trade the second bottom
In strategic terms, a more appropriate trading roadmap is to “game the second-bottom process” rather than “going all in ahead of a Santa rally.”
Operationally, positions can be managed around the 20-day moving average of S&P 500 index futures: as futures prices rebound toward the 20-day line, investors can selectively establish short positions in the Nasdaq 100.
If the index then breaks decisively above the 20-day moving average on rising volume and accelerating momentum, those short positions should be cut promptly, acknowledging that the bearish trade has failed and waiting to increase long equity exposure only once a clearer right-side bullish signal emerges.
In parallel, the strategy calls for buying volatility on dips using the VIX.
One approach is to lightly sell weekly VIX put options at or below prior low levels when the index retests those lows,
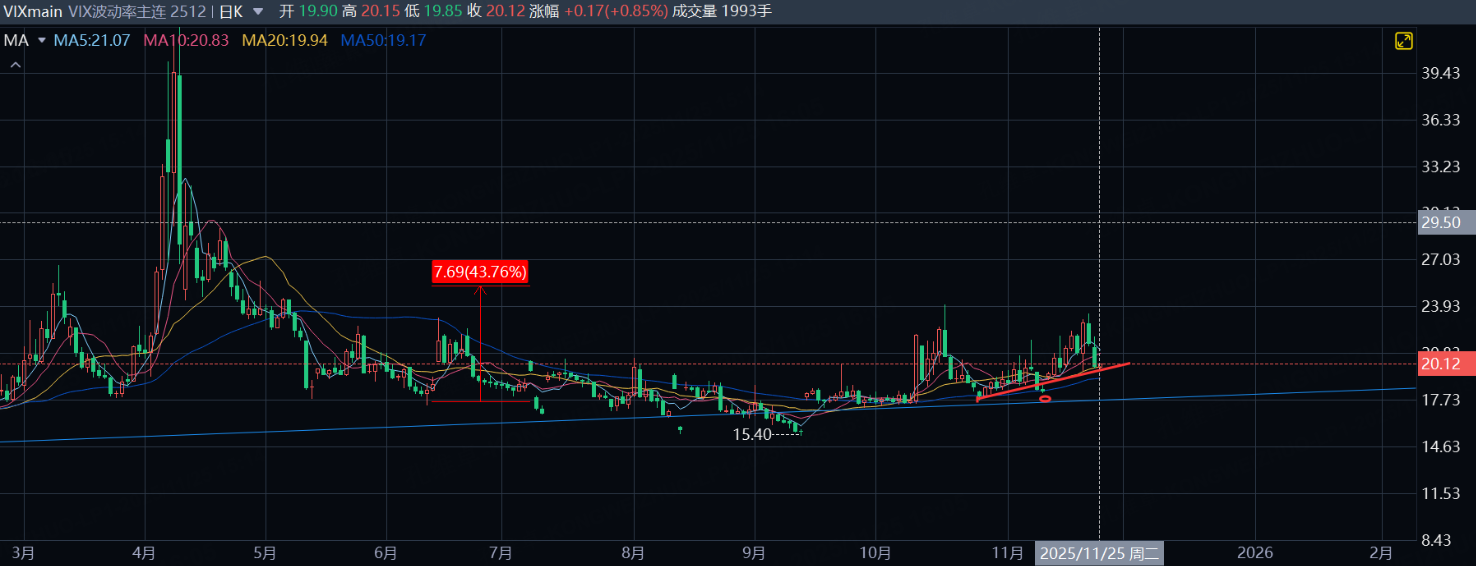
thereby leaving room to profit from a rebound in volatility. Another is to gain long exposure to VIX via leveraged long-volatility ETFs or futures, or by purchasing VIX call options expiring in about two weeks, in order to hedge the risk of a second leg down in the indices.
Under this framework, if S&P 500 futures eventually break above the neckline and transition into a genuine uptrend, the investor can simply treat the “crash insurance” as having expired worthless, stop out of long volatility, and simultaneously scale up long positions in the underlying equities.
$NQ100指数主连 2512(NQmain)$ $SP500指数主连 2512(ESmain)$ $道琼斯指数主连 2512(YMmain)$ $黄金主连 2512(GCmain)$
Disclaimer: Investing carries risk. This is not financial advice. The above content should not be regarded as an offer, recommendation, or solicitation on acquiring or disposing of any financial products, any associated discussions, comments, or posts by author or other users should not be considered as such either. It is solely for general information purpose only, which does not consider your own investment objectives, financial situations or needs. TTM assumes no responsibility or warranty for the accuracy and completeness of the information, investors should do their own research and may seek professional advice before investing.
