3.21K

·
2025-05-01
PLTR: Is a $200 Price Target Too conservative? 😯
1. $Palantir Technologies Inc.(PLTR)$ surged to a high of $125 before retracing nearly 50% to $66, triggering a wave of bearish sentiment. Many called the move overdone and claimed the stock was destined to return to $10. But those takes have aged poorly. The stock has now reclaimed the key psychological level of $100 and is just $6 away from breaking its all-time highs.If $PLTR can reclaim $125 and consolidate above it, we believe the next leg higher could be explosive — first targeting $170, and then potentially overshooting to $200. But here’s the twist: that $200 target may actually underestimate what’s coming.We now expect PLTR to reach $300 by end of 2026. Here’s why:Gov Contracts Keep Expanding: Palantir is deeply embedded in U.S. defense a
1.50K
·
2025-05-01
Trading Ideas| Last Kiss of 5500
Hello everyone! Today i want to share some trading ideas with you!1.Option Two: $S&P 500(.SPX)$ (1) I laid out 2 options for MPW subs in Bamboo --based on what happened today & futures, I believe option 2 is the correct path forward. (2) on 4/26, I drew a blue square as potential target box for the rally, now, SPX future rose inside it. THAT IS IT!Image2.MPW Mid-Week Update Posted: (1) fast-paced moves on both directions--a typical character of a bear market at its early stage. (2) the whip-saw creates a false sense of security, as if you won't lose much if you can hold your position. Image3.LAST Kiss of 5500: (1) Those dip-buyers over the last few sessions were caught with their pants down at the open; however, their delusional habit will
2.96K

·
2025-05-01
Investment Diary, 29 Apr 2025 Pony.ai & WeRide
Regarding Pony.ai and WeRide, I’ve conducted some research and analysis for your reference. First, the conclusion: In the Robotaxi sector, Pony.ai has greater growth potential, while WeRide may struggle to gain upward momentum. 1. Core Business Pony.ai’s core business is software programming, whereas WeRide’s is automotive manufacturing. The former has lower marginal costs, offering more room for imagination in the investment market. From their current operations, Pony.ai is more focused. It concentrates on the rapidly growing Robotaxi sector while also developing Robotruck, targeting China and the U.S. WeRide is more diversified, with five business lines: Robotaxi, Robobus (autonomous minibuses), Robovan (autonomous delivery vehicles), Robosweeper (autonomous sanitation vehicles), and ADA
1.47K
·
2025-04-30
I have only 3 stocks. Here are some few thoughts on each: 1. $PLTR remains my core conviction. I have no doubts about the strength of the operating side, which is improving every day. AI FDE could make the company 10x faster in acquiring new customers and expanding existing ones. Palantir is not only improving. Its improvement speed is exploding. The only concern is on the valuation because it already incorporates sustained growth. For the stock to keep growing, we will need to see some WOW things, like 40% growth. I believe there are good chances we will see it in the coming quarters. Notice: While the AI sphere is booming, there are still no "AI IPOs". This makes me think we are still early in the cycle... 2. $HOOD is my favourite relatively undiscovered gem. Financial professionals are
TOPValerie Archibald: tomorrow tsla will be up $300. I guarantee it
558
·
2025-05-01
The reason why going AI-first company
I think a lot of companies (maybe most) think like this. But saying you’re “AI-first” and being AI-native are two different things. I fear a lot of companies burning bridges to a brighter future where they still don’t have an advantage.The more I invest, the more I am convinced the perfect level of stock research is far shallower than most people think.If you know specifics about contracts, do channel checks, build models, you're too deep.See the forest. It will lead to simpler & better decisions.Keep in mind: Bear Stearns failed in March 2008 when unemployment was 5.1%Lehman Brothers Failed in September 2008 when unemployment was 6.1%The stock market bottomed in March 2009Unemployment peaked in October 2009There's a lag between the catalyst and the outcome.For whom haven't open CBA ca
63.05K
·
2025-04-30
Elliott Wave Forecast: Nike ($NKE ) Rally to Fail in 7-Swing Pattern
Nike (NKE) shows a bearish trend that began at its peak on November 8, 2021, indicating potential for further declines. On a shorter cycle, the stock’s drop from its October 1, 2024 high is developing as an impulsive Elliott Wave structure, characterized by sharp downward moves. From that high, wave (1) concluded at $68.62, followed by a wave (2) recovery that peaked at $82.44. The stock then continued its descent in wave (3), reaching $50.87, as illustrated in the 45-minute chart below. Currently, Nike is in a corrective phase, forming wave (4) as a double three Elliott Wave pattern. From the wave (3) low, wave ((a)) rose to $59.22, followed by a wave ((b)) dip to $51.90. The subsequent wave ((c)) advance ended at $59.76, completing wave W. A pullback in wave X bottomed at $52.28, and the
62.69K
·
2025-04-30
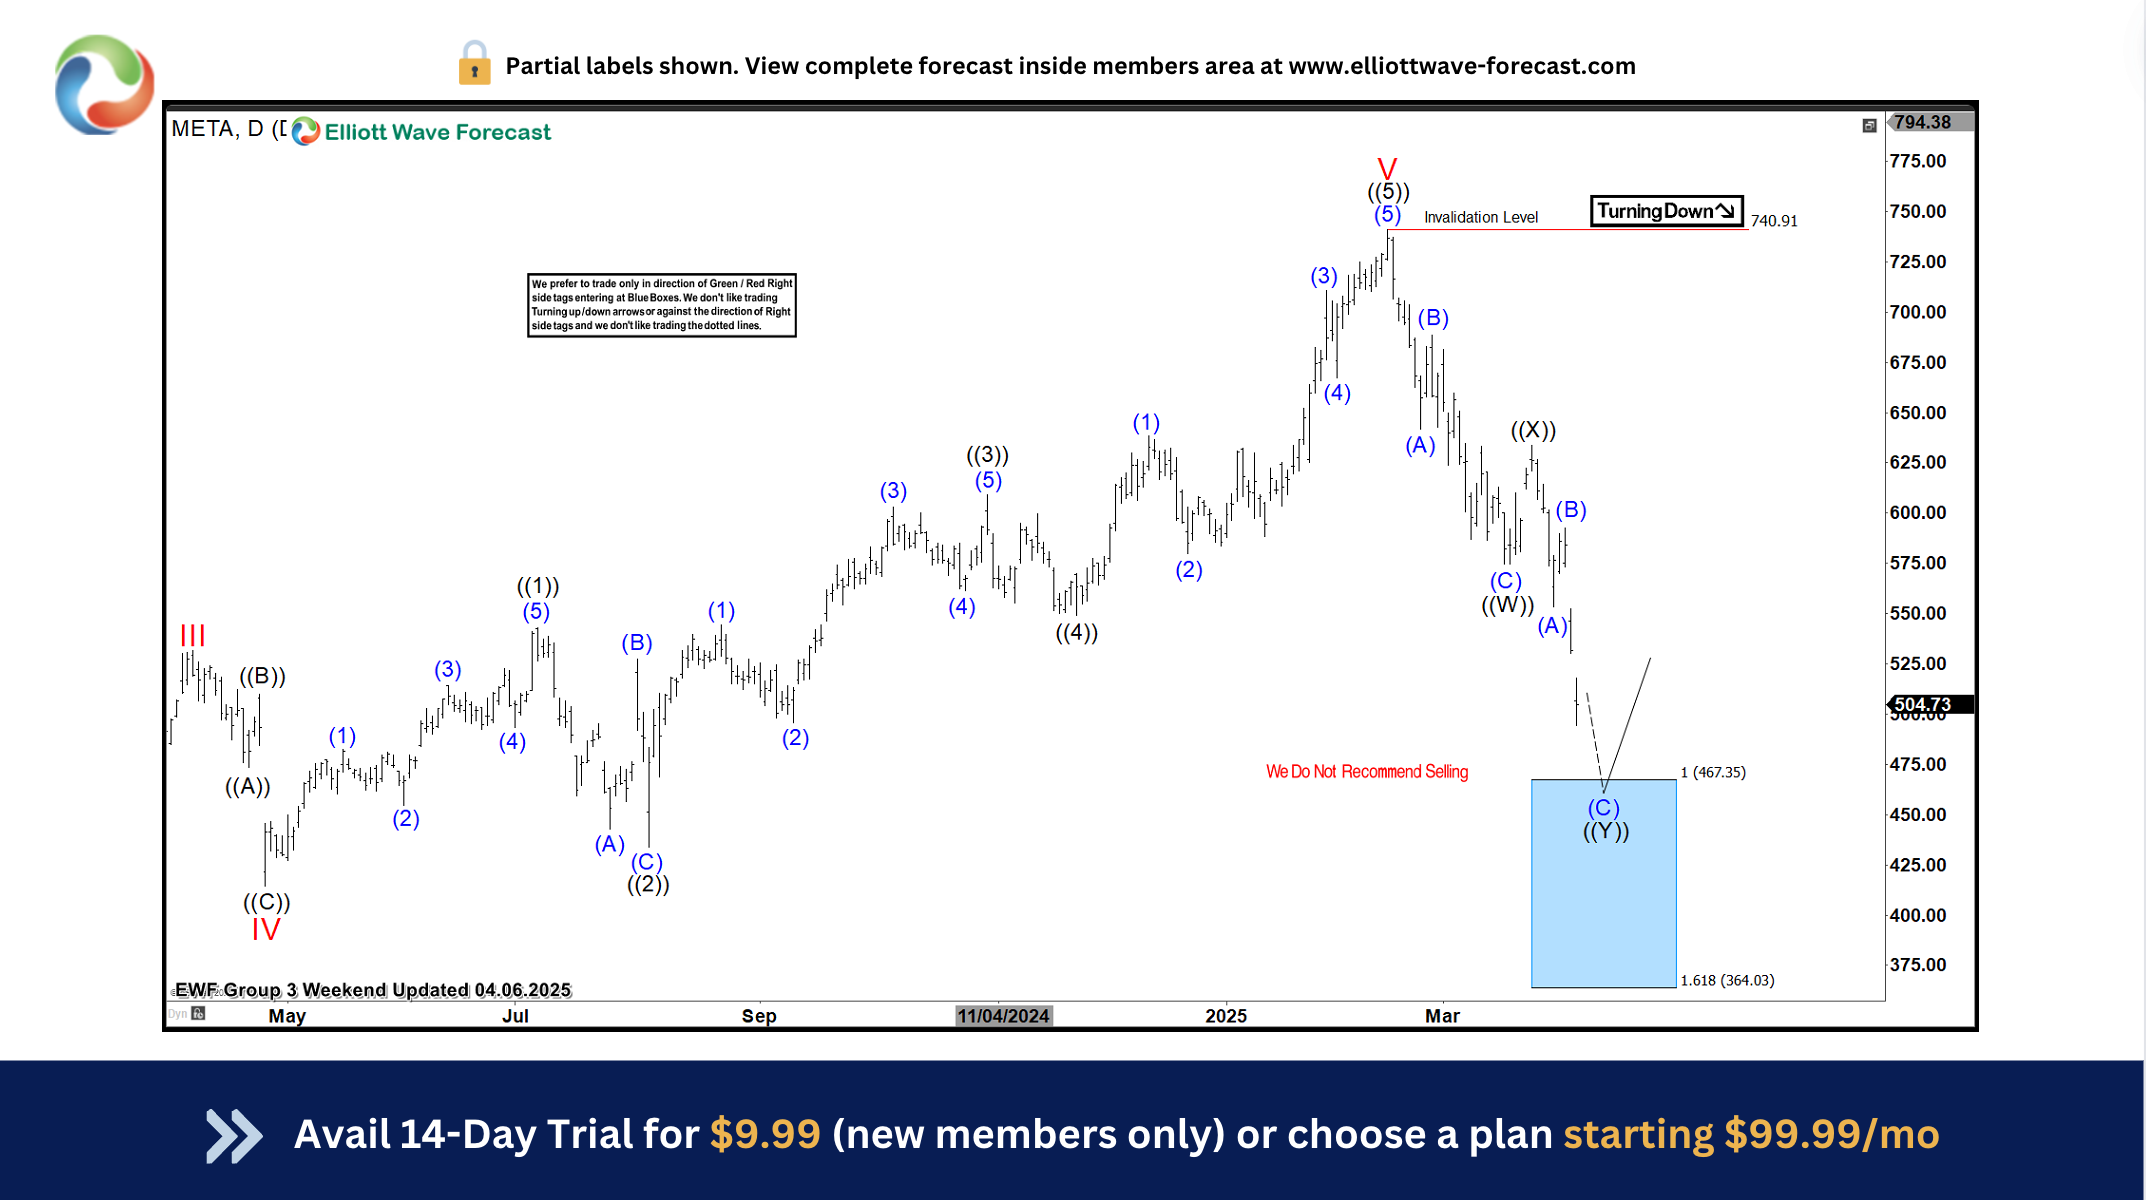
The Blue Box Area Blog: Meta Elliott Wave Reactions
In this technical blog, we will look at the past performance of the Elliott Wave Charts of the Facebook ticker symbol: META. We presented to members at the elliottwave-forecast. In which, the rally from the October 2022 low ended as an impulse structure. But higher time frame charts supported more upside extension to take place as the main trend remains bullish to the upside. Therefore, we advised members not to sell the stock & buy the dips in 3, 7, or 11 swings at the blue box areas. We will explain the structure & forecast below: META Daily Elliott Wave Chart From 4.06.2025 Here’s the Daily Elliott wave chart from the 4.06.2025 Weekend update. In which,
62.71K
·
2025-04-30
Royal Caribbean Cruises (RCL) Eyes Bullish Breakout Above $300
Royal Caribbean Cruises Ltd (NYSE: RCL), a top global cruise company, has overcome challenges and is poised for more growth. Since the 2020 crash, the stock has achieved remarkable growth, surging over +1000% and reaching new all-time highs. This impressive rally underscores its bullish momentum and resilience in overcoming past challenges. This article explores Elliott Wave analysis, revealing bullish patterns that could attract investors and traders alike. RCL Weekly Chart Elliott Wave Analysis The above weekly chart of RCL shows an impulsive 3 waves move into new highs from wave ((II)) low $19. Wave (I) at $99, wave (II) at $31, wave (III) at $277 and recently it ended wave (IV) pullback at $164. Consequently, the current sequence is incomplete and it’s expected to rally high
62.76K
·
2025-04-30
Dow Futures (YM_F) Elliott Wave Calling the Rally After 3 Waves Pull Back
Hello fellow traders. In this technical article we’re going to look at the Elliott Wave charts of Dow Futures (YM_F) published in members area of the website. As our members know, YM_F is trading within the cycle from the 36635 low. Recently, we forecasted the end of the short-term pull back and called for a further rally. In the following text, we’ll explain the Elliott Wave analysis and present target areas. YM_F Elliott Wave 1 Hour Chart 04.21.2025 Dow Jones Futures is forming a three-wave pullback which still looks incomplete at the moment. Our members know that we can easily identify the reversal area by measuring the Equal Legs zone, ((a)) related ((b)), which comes in at the 38531-37940 area. We expect buyers to appear within the
556
·
2025-04-30
If we have negative GDP again next quarter, we’ll technically be in a recession. The Fed is in a very tough spot. Inflation is still sticky in certain areas but growth and labor are stalling out. The Fed can’t cut too aggressively without risking another inflation spike and they can’t hold rates this high without pushing the economy further into contraction. There are downsides to both cutting and holding rates here but in my opinion the Fed is behind the curve and needs to start easing. They shouldn’t wait for the economy to break before cutting I don’t think a recession is inevitable but the warning signs are flashing. It’s time for Powell to step in
303
·
2025-04-30
U.S. GDP shrank -0.3% in 1Q (vs +0.4% exp) as Trump’s economic policies weighed on consumer and business sentiment. Consumer spending was +1.8% and net exports reduced 1Q GDP by -5pp due to accelerated purchases in front of tariff hikes. Separately, ADP March private payrolls were +62K vs +120K expected. We are very likely in recession as consumers continue to pull back.
1.02K
·
2025-04-30
In view of the superb sentiment, Pop Mart should be breaching the All Time High 52 weeks in due time. Associated net income for next Q should be increased due to high demand for their popular toys such as Labubu especially. Hence, Pop Mart might set a new record for its share price. Cheers.
2.66K
·
2025-04-30
Take note that the $TRUMP dinner invitation terms include a disclaimer that “President Trump may be unable to attend’. It may turns out to be a meeting among the top 220 buyers of the $TRuMP on 22 May 2025. This itself looks attractive to me because it is a good chance to meet 219 likeminded crypto investors. On the other hand, bringing 7 guests to lunch with Buffett at Smith & Wollensky steakhouse (costing <$100) in New York is a good charitable act, with millions of dollars donated to foundations supporting the homeless, the poor, and other vulnerable groups. Thanks @Tiger_comments @icycrystal
2.66K
·
2025-05-01
Daily Charts - SPX oversold indicators already snapped back
1.Market heading into a major pinch-point here, oversold indicators already snapped back, while 5600 + 50dma overhead resistance means technically this would be a very convenient point for some bad news/excuse to show up... $S&P 500(.SPX)$ $SPDR S&P 500 ETF Trust(SPY)$ Image2.Stocks are starting to lose ground vs Bonds, and it may just be the start...Valuations say the odds favor bonds vs stocks (stocks are expensive absolute + vs bonds, while bonds are cheap)Image3.Nothing new...Rug-pulls and Bag-holders are not a new concept, in fact there were plenty of that sort of thing back during the dot com bubble. ImageFor whom haven't open CBA can know more from below:🏦 Open a CBA today and enjoy privileg
1.57K
·
2025-05-01
Hot Stock Charts - SPY & TSLA
1. $SPDR S&P 500 ETF Trust(SPY)$ The S&P 500 has rallied 12% since we called the bottom four weeks ago at the exact bottom of the market bias band.2. $Tesla Motors(TSLA)$ Nobody’s spending tens of thousands of dollars to turn their Toyota into a part-time robotaxi. Let’s be real. I’m not a Tesla perma-bull—there’s a real chance they blow this.But who’s seriously going to bolt LiDAR, radar, and a full sensor suite onto their Camry just to make a few hundred bucks a month?Waymo is ahead today—no question.But this isn’t about today.It’s about execution.If Tesla pulls off what they say they’re building, they won’t just catch up… they’ll leapfrog Waymo by 10x.For whom haven't open CBA can know more from
1.79K
·
2025-05-01
SPY and QQQ positioned just below their declining 50DMA
''Sell in May and Go Away'' , average returns -0.1% since 1928, have often been muted, with higher volatility.We’ll begin trading for May 1st in the later session, with both $SPDR S&P 500 ETF Trust(SPY)$ and $Invesco QQQ(QQQ)$ positioned just below their declining 50-day moving averages, as the market sits at a broadly extended short-term breadth level.If you're already positioned long, stay disciplined with your plan—whether that’s scaling out into strength, using trailing MA stops, or a hybrid approach. Market can further extend to expand your unrealized profits, no one can predict.If you're on the sidelines with a watchlist of setups nearing entry, be aware there's an imminent pre-market risk event o
781
·
2025-05-01
SPX - From -2% to +0.15%, How is it Possible?
$S&P 500(.SPX)$ - From -2% to +0.15%, How is it Possible?Simple answer: Breadth Trust, the impulse that the market has is significant, for that reason the dips are bought quickly. Price is overbought relative to Stochastic but not to RSI, and the candle suggests green continuation tomorrow. ➡️These are the times of buying the dip.Image $Netflix(NFLX)$ NFLX - Remember the FANGs? This stock lost popularity in 2022, so it was not included in the "Magnificent" list, but so far this is performing better than the Mag 7; setting fresh all time highs. The fundamental and technical analysis is open for everyone through the link in my profile. Get access!ImageFor whom haven't open CBA can know more from below:🏦
1.53K
·
2025-05-01
MSFT - AI nearly 50% of Azure’s + 35% y/y
Satya Nadella “we processed 50 TRILLION tokens last month.” AI nearly 50% of Azure’s + 35% y/y. Demand is growing faster than supply, accelerated in the Q - expect capacity constraints post June. Trying to get more data center capacity online to satisfy demand. 💥🚀💪ImageAzure at a ~$77B run rate growing 35% constant currencyLast year they restated Azure, so some of the historical comparisons won't be apples to apples. PowerBI and EMS are no longer included in Azure Quarterly YoY growth trends below MSFTImageEstimates of Net new quarterly ARR added:ImageYoY growth in quarterly net new ARR addedImageFor whom haven't open CBA can know more from below:🏦 Open a CBA today and enjoy privileges of up to SGD 20,000 in trading limit with 0 commission. Trade SG, HK, US stocks as well as ETFs unlimited
1.61K
·
2025-05-01
April’s factsheet
There were no outright sales or purchases. The top contributors to performance were ATOSS Software $ATOS SE(ATSEF)$ and Cadence Design Systems $Cadence Design(CDNS)$ . The top detractors from performance were $NVIDIA(NVDA)$ and $Fortinet(FTNT)$ .ImageThe best businesses don’t need to burn cash to grow. Low reinvestment requirements mean more free cash flow.Look for low CAPEX, tight working capital, a low R&D margin and high returns on capital.Capital efficiency requires cash efficiency.For whom haven't open CBA can know more from below:🏦 Open a CBA today and enjoy privileges of up to SGD 20,000 in trading limit with
3.25K
·
2025-04-28
$Tesla Motors(TSLA)$ Tesla is raising prices in Canada and encouraging buyers to snap up cars that were imported before counter-tariffs were imposed on U.S.-made vehicles.